Market Recap for Friday, January 18, 2019
Continuing anticipation of a trade deal with China appeared to fuel very solid stock market action on Friday as all of our major indices pushed higher, as did all 11 sectors. The Dow Jones and S&P 500 led the charge, gaining 1.38% and 1.32%, respectively. Energy (XLE, +2.03%) led on a relative basis as crude oil ($WTIC) neared $54 per barrel, its highest close in two months - prior to the December swoon. Oil equipment & services ($DJUSOS, +5.14%) exploded to the upside, buoyed in part by a very positive reaction to Schlumberger's (SLB, +8.12%) quarterly earnings report. That strength came on very heavy volume and enabled SLB to clear its 50 day SMA:
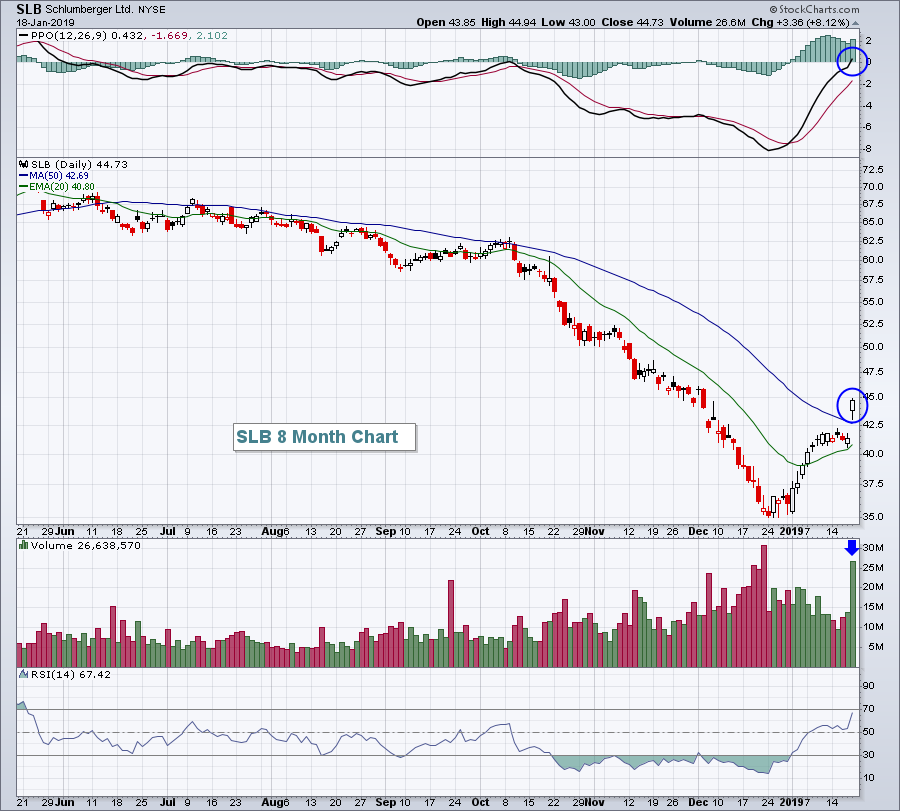 After the massive decline in SLB shares in the second half of 2018, I'd suspect the bottom is in. Therefore, pullbacks in the form of 20 day EMA tests could be considered for entry in 2019. Gap support at 41.37 should be quite strong as well.
Industrials (XLI, +1.90%) and financials (XLF, +1.72%) also had very strong days as the rising 10 year treasury yield ($TNX) touched the 2.80% level on Friday before backing off slightly. The fact that money is rotating from the more defensive treasuries to aggressive equities is aiding the overall market, but more specifically aiding financials that benefit directly from rising yields - areas like banks ($DJUSBK), which gained 7.37% in just the past week.
Utilities (XLU, +0.11%) and real estate (XLRE, +0.37%), two defensive groups, lagged the overall action on Friday and that relative weakness should be viewed bullishly.
Pre-Market Action
Global markets were weak overnight and this morning. Crude oil ($WTIC) is down 1.60% and back below $53 per barrel after testing a key $54 per barrel level. Also, money is rotating this morning to treasuries with the 10 year treasury yield ($TNX) falling beneath 2.75% just one day after an apparent breakout above key yield resistance on Friday.
This has put pressure on U.S. futures (Dow Jones futures are lower by 157 points at last check) as we open up a holiday-shortened week. Earnings reports will begin to accelerate this week and next as Wall Street tries to digest what are likely to be very mixed reports.....all amidst the backdrop of a partial government shutdown now a month long - the longest in U.S. history.
I know there's an old Wall Street adage that says the stock market "climbs the wall of worry". Well, the bulls may need to get out their climbing gear - at least at today's open.
Current Outlook
Transportation ($TRAN) gained 2.62% on Friday and closed above its 50 day SMA for the first time since the beginning of December. That's certainly good news from a short-term perspective, but the weekly chart offers up a bit more of a technical test this week:
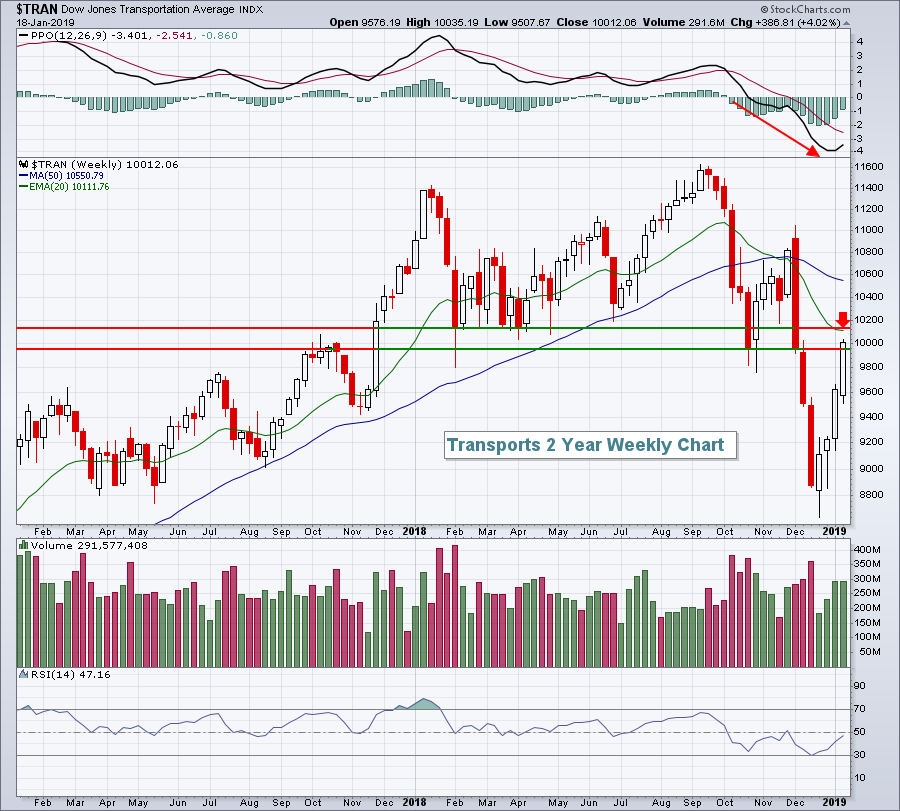 Any time I see a PPO printing fresh lows along with new price lows, I look for declining 20 period EMAs to provide solid resistance. The TRAN is nearing that key moving average (red arrow) and is in a price resistance zone - the prior support zone that was broken during the December selling. We are likely going to see many more sellers lining up on transports this week, so a close on Friday above the 10100-10200 zone would be impressive.
Sector/Industry Watch
Clothing & accessories ($DJUSCF, +5.77%) soared on Friday after component VFCorp (VFC, +12.39%) posted better-than-expected earnings. Over the past month, the DJUSCF has risen more than 13%, helping to lead consumer discretionary higher. The group was pummeled in Q4 like so many other areas, but last week's strength propelled the group above price resistance and its declining 20 week EMA:
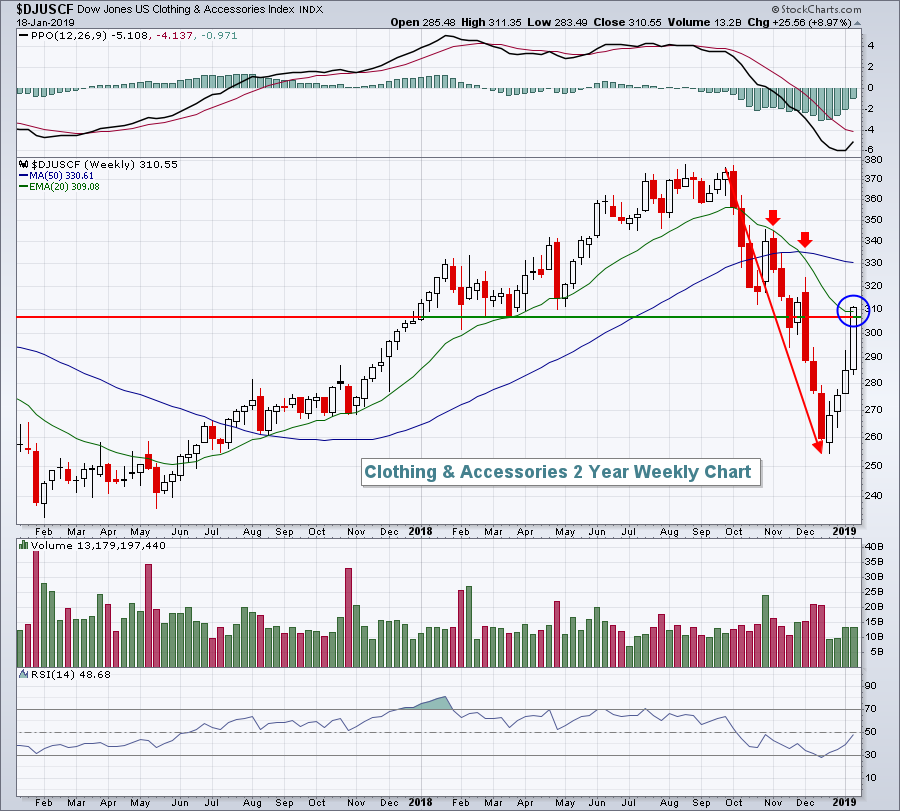 The red directional line shows that a year's worth of gains was lost in the span of about 10 weeks in Q4. The rally has been very nice, but can the DJUSCF sustain its move above the 20 week EMA. That will be a major test for any sector or industry that's reclaimed that key moving average in the past week or so.
Monday Setups
Apollo Global Management (APO) had a very solid week last week, but is facing serious overhead price resistance as it begins a new week. Therefore, I like the short side of this trade with a tight stop in the event the four week rally continues:
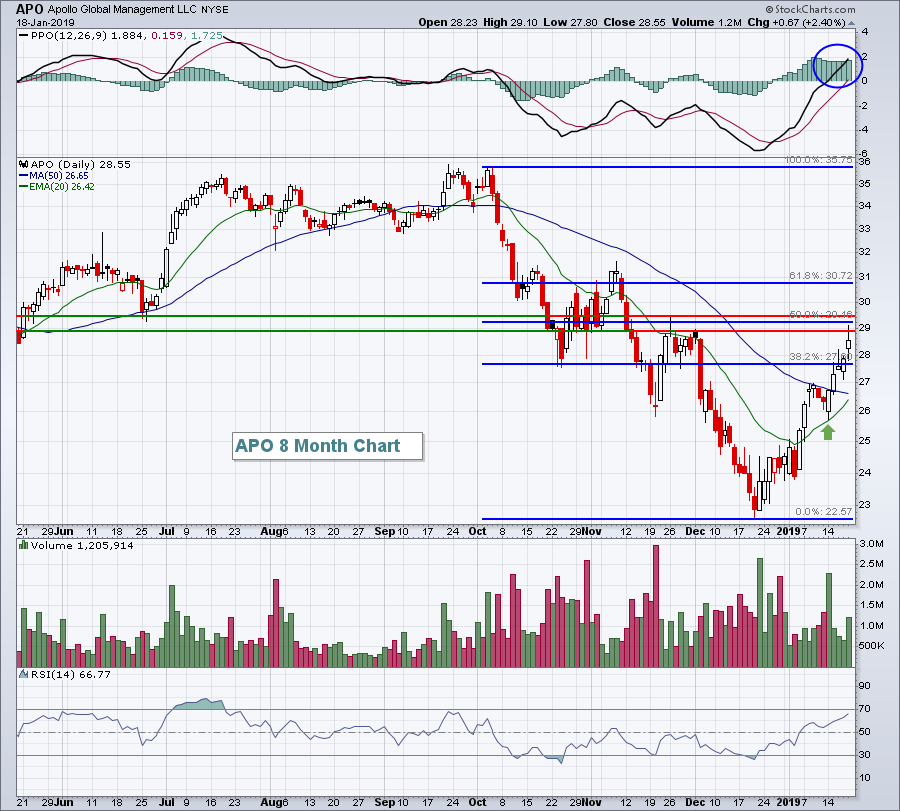 In addition to overhead price resistance, the 50% Fibonacci retracement level is just above 29 and was tested on Friday. I'd be careful on a close above 29.50. Otherwise, I'd look for a move back down to 26.50-26.75 and if the rising 20 day EMA doesn't hold, a trip all the way back to 23 is quite possible.
Historical Tendencies
Here is a breakdown of calendar month performance on the Russell 2000 since 1987:
25th through 6th: +25.41%
7th through 10th: -11.54%
11th through 18th: +15.30%
19th through 24th: -14.79%
Key Earnings Reports
(actual vs. estimate):
EDU: (.16) vs (.05)
FITB: .69 vs .67
HAL: .41 vs .37
JNJ: 1.97 vs 1.95
PLD: .79 (estimate - awaiting results)
STLD: 1.31 vs 1.25
SWK: 2.11 vs 2.11
TRV: 2.13 vs 2.20
(reports after close, estimate provided):
AMTD: 1.00
COF: 2.40
IBKR: .59
IBM: 4.81
ZION: 1.06
Key Economic Reports
December existing home sales to be released at 10:00am EST: 5,240,000 (estimate)
Happy trading!
Tom
