Market Recap for Wednesday, June 26, 2019
It was a day of bifurcated action as the NASDAQ was able to cling to a 0.32% gain, but the other major indices fell. Honestly, it felt like a down day on the NASDAQ as well. This tech-laden index surged to a 90 point gain right out of the gate, but saw those early gains erode throughout the session. There were definitely positives that emerged yesterday, however. One of the biggest was an earnings surprise out of Micron Technology (MU, +13.34%), which also indicated a subtle improvement in demand seemed to be in place. If you recall, Broadcom (AVGO, +1.78%) recently suggested that a very challenging environment ahead. So MU helped to put some of those fears to rest, even if just temporarily. The MU chart still has much work left:
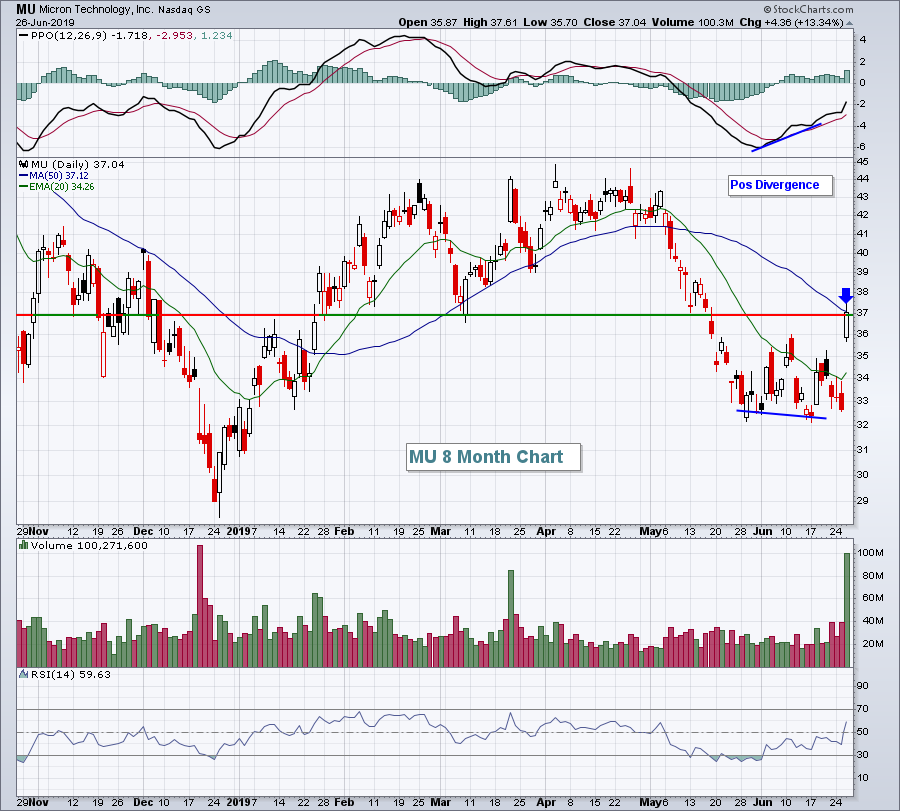 The positive divergence pointed to a 50 day SMA test and we saw that yesterday. There's also key price resistance near 37 as well. If MU can sustain yesterday's advance and break above its 50 day SMA on a closing basis, it would be a confirming signal with yesterday's gap open at 35.87 and the now-rising 20 day EMA serving as key support levels on bouts of selling.
Energy (XLE, +1.54%) was the leader during Wednesday's session, however, as crude oil ($WTIC, +2.68%) surged to test overhead price resistance near $60 per barrel. While that initial test failed, crude oil and the XLE both finished with very solid gains.
Pre-Market Action
Asian markets were strong overnight with most indices there rising more than 1%. European markets, meanwhile, were much more mixed. Here in the U.S., futures are also mixed with much more relative strength in the aggressive NASDAQ after both NVIDIA Corp (NVDA) and Advanced Micro Devices, Inc. (AMD) received upgrades.
With 45 minutes to the opening bell, Dow Jones futures were down by 6 points, while NASDAQ futures were higher by 34 points.
Current Outlook
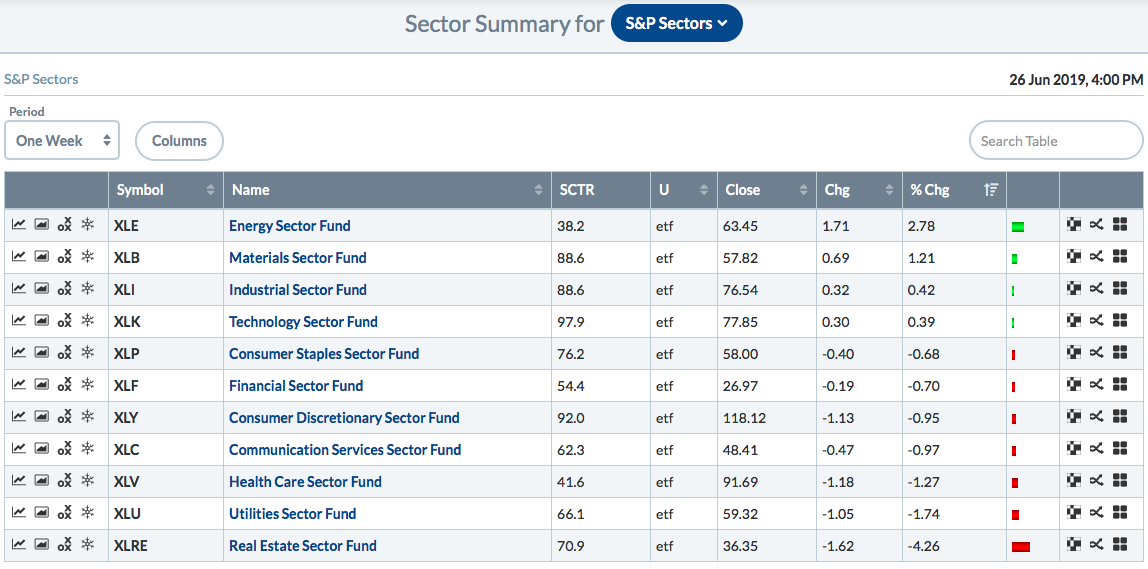
Energy (XLE) led the stock market higher on Wednesday and has been the undisputed one week leader as well. One glance at the following sector summary for the past week says it all:
 But here's the problem. One week doesn't make a trend. Need proof? Let's take a look at a long-term 5 year weekly chart of the XLE. The absolute chart shows a lot of sideways action, while the relative chart shows significant underperformance:
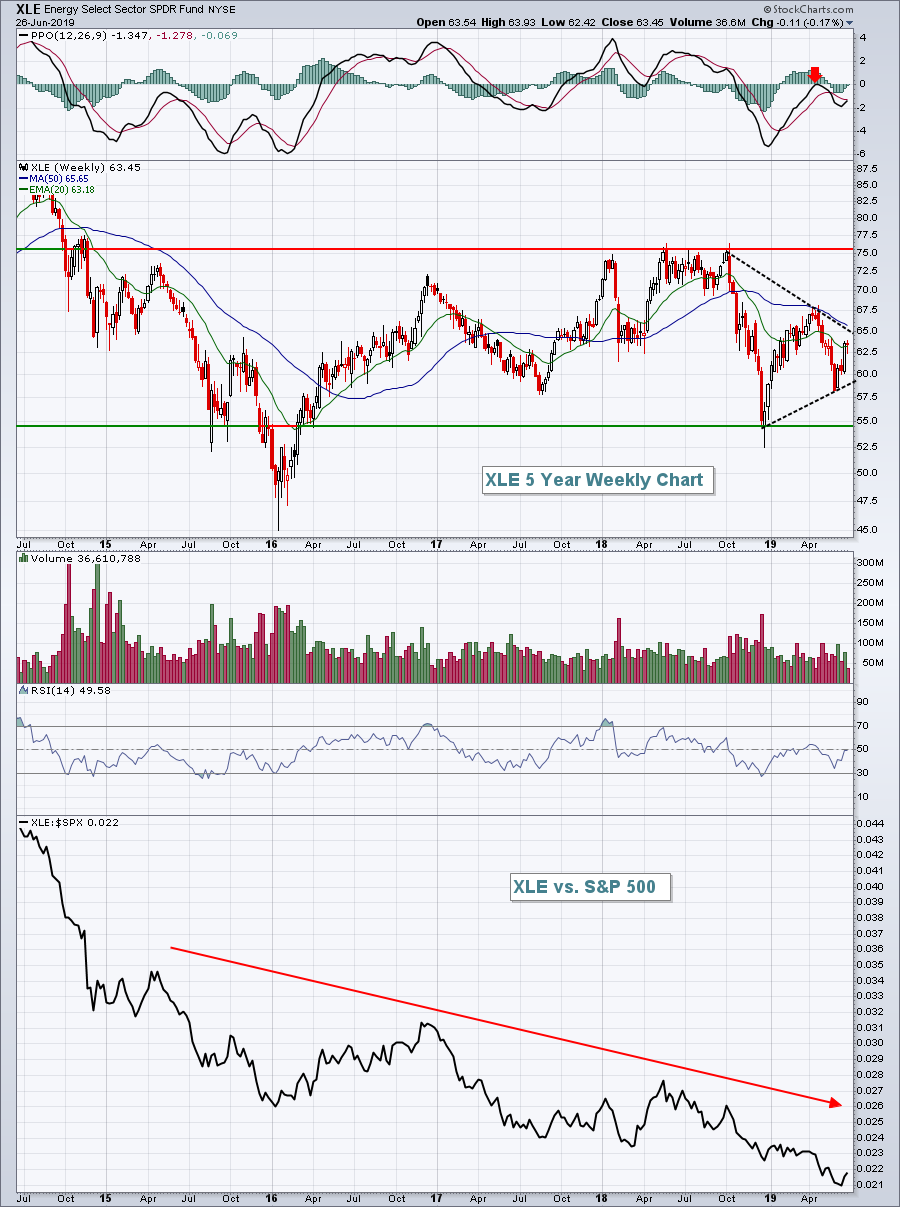 The bottom half of the chart is what really interests me. The XLE has a very strong track record of not being able to keep up with the benchmark S&P 500. If my goal is to outperform that benchmark, how can I do it by investing in energy?
It's going to take more than one solid week to get my attention.
Sector/Industry Watch
The Dow Jones U.S. Hotels Index ($DJUSLG, +0.99%) rallied on Wednesday and closed back above its 20 day EMA, one day after failing to hold that key moving average. Should it be able to remain above its 20 day EMA, it would be a very bullish sign as recent action appears to be printing a handle off of a recent cup-like formation:
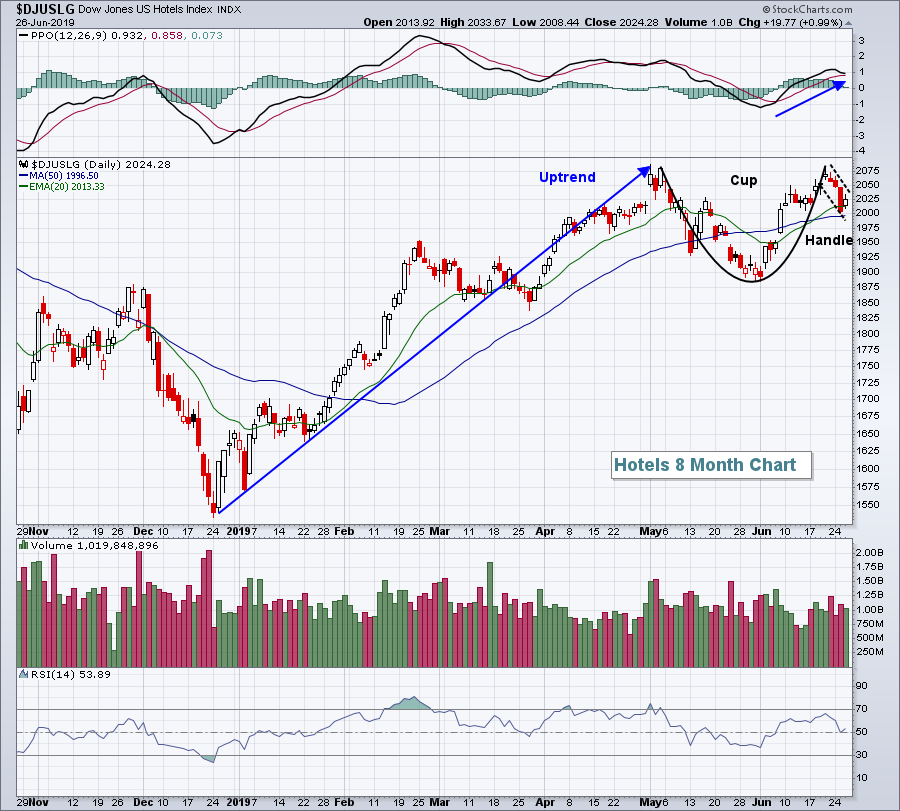 I don't like to see a handle fall beneath 50% of the cup's depth, so any close beneath the 50 day SMA would negate the pattern in my view, while a breakout above 2075 would "measure" another 190 points higher.
Historical Tendencies
Caterpillar (CAT, +1.08%) has had a very strong month of June, rising close to 13% since ending May close to the 120 level. The good news is that CAT loves the month of July, where it's averaged gaining 4.2% over the last two decades:
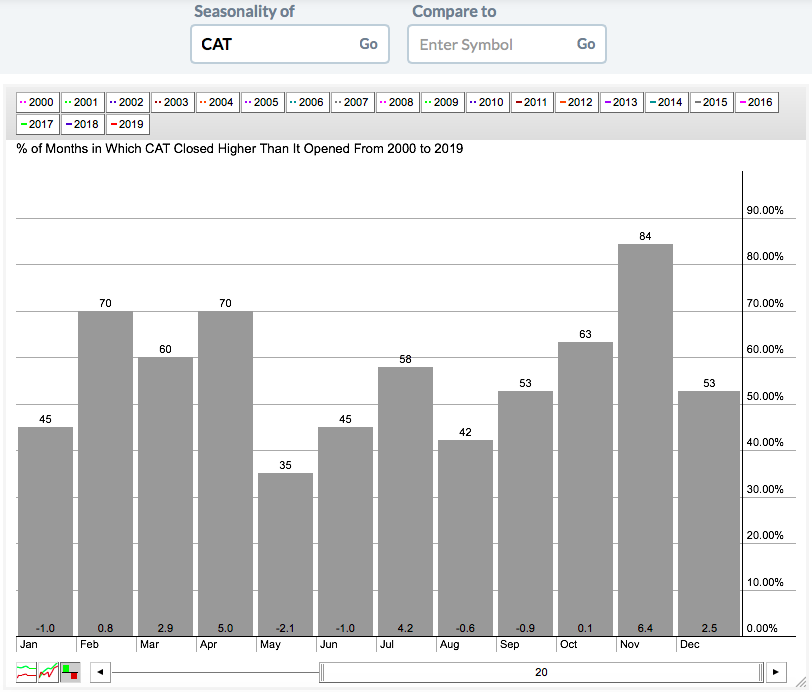 That July performance really stands out when compared to the other summer months that surround it. In addition, July trails only November (+6.4%) and April (+5.0%) as its best performing calendar month of the year.
Key Earnings Reports
(actual vs. estimate):
ACN: 1.93 vs 1.88
CAG: .36 vs .42
MKC: 1.16 vs 1.09
SJR: .25 - estimate, awaiting results
WBA: 1.47 vs 1.42
(reports after close, estimate provided):
NKE: .66
Key Economic Reports
Initial jobless claims released at 8:30am EST: 227,000 (actual) vs. 218,000 (estimate)
Q1 GDP (final estimate) released at 8:30am EST: 3.1% (actual) vs. 3.1% (estimate)
May pending home sales to be released at 10:00am EST: +0.6% (estimate)
Happy trading!
Tom
