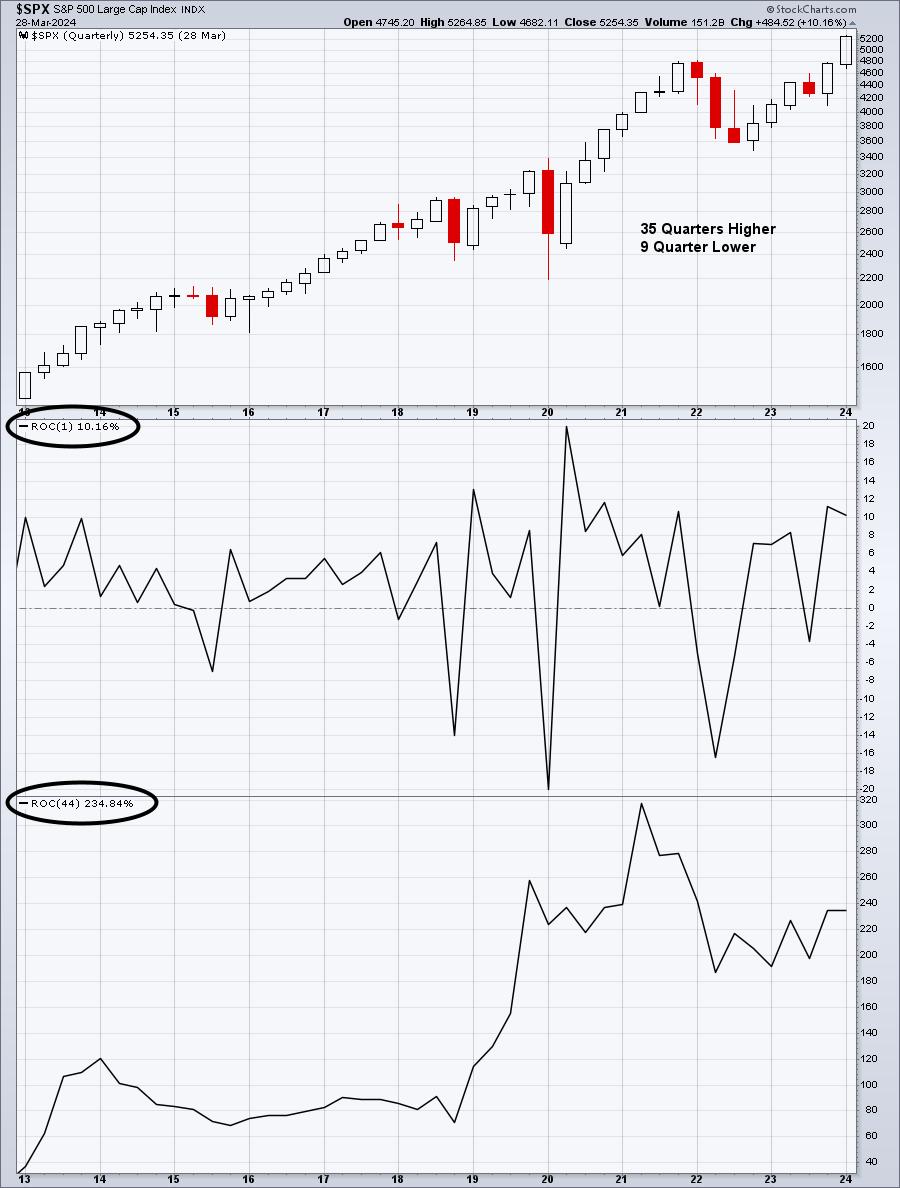
Let's start off by reviewing a quarterly chart of the S&P 500 ($SPX), NASDAQ 100 ($NDX), and Russell 2000 (IWM) since this secular bull market began in early-April 2013 (44 quarters ago):
S&P 500:
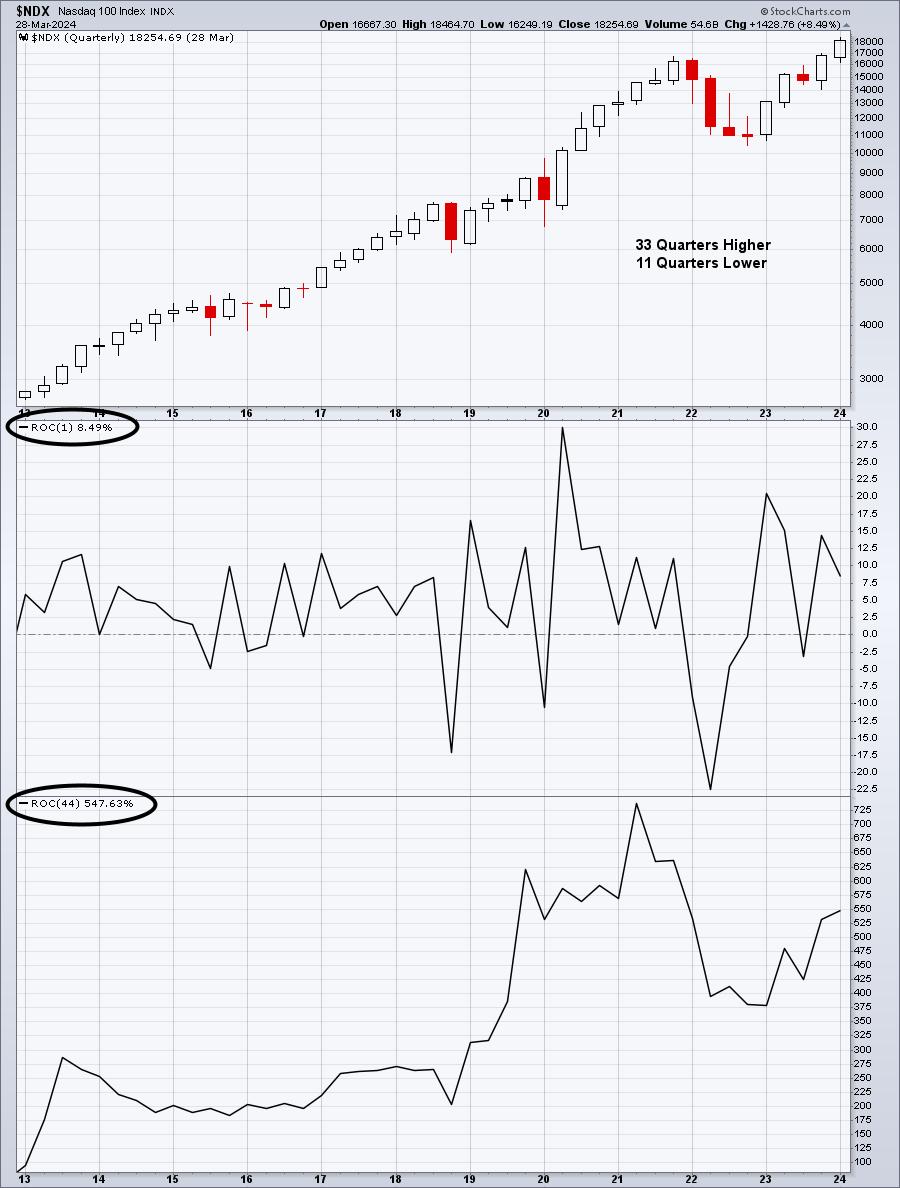
NASDAQ 100:
Russell 2000:
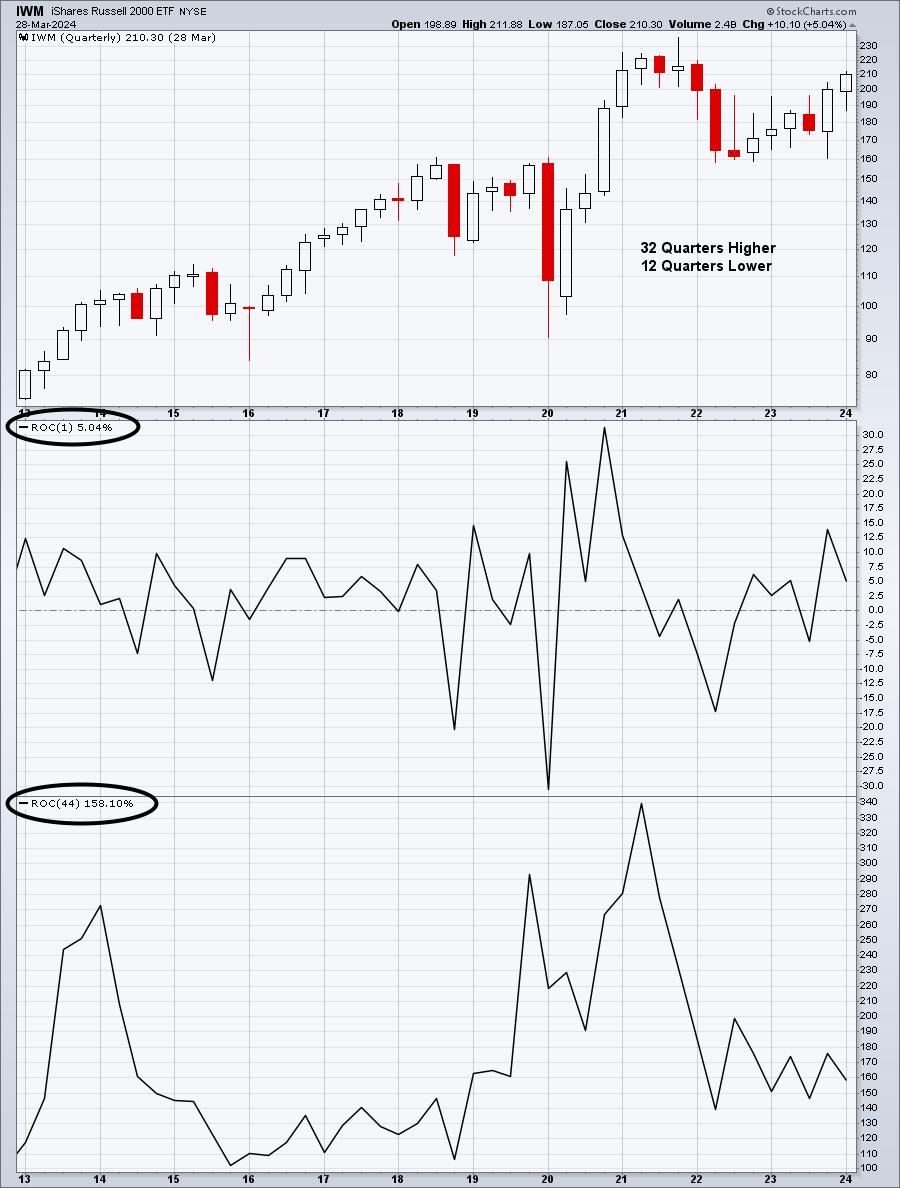
When you look at these 3 charts, an obvious first conclusion can be made. If we're in a bull market, we want to be invested in the NASDAQ 100 stocks, which have dominated both the S&P 500 and Russell 2000. The 44-quarter rate of change (ROC) provides us roughly the gains made on each of these indices since the secular bull market began in 2013, 11 years ago.
Before we write off the small cap stocks, however, we need to use some perspective and understand that this asset class moves into and out of favor. Because it's underperformed the NASDAQ 100 badly these last 11 years, it makes sense to stick with NASDAQ 100 stocks until small caps tell us otherwise. They could be telling us otherwise right now. Check out this 11-year weekly absolute price chart of the IWM and note when it has outperformed the NASDAQ 100 in the past:
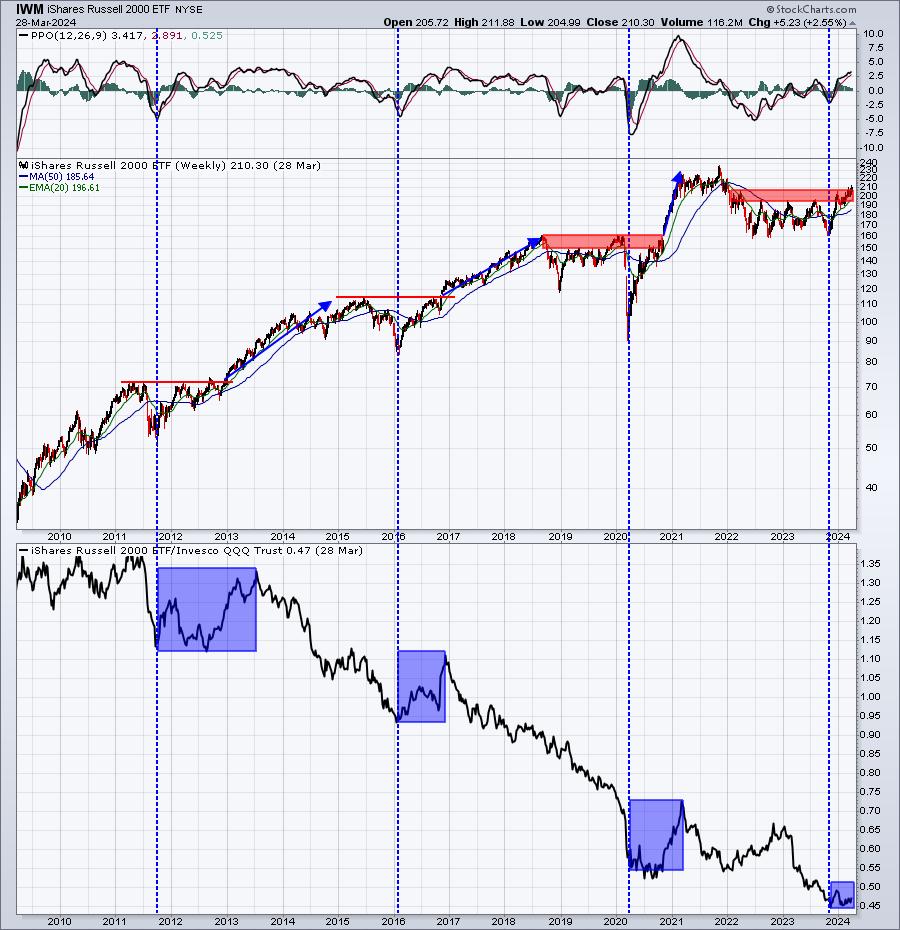
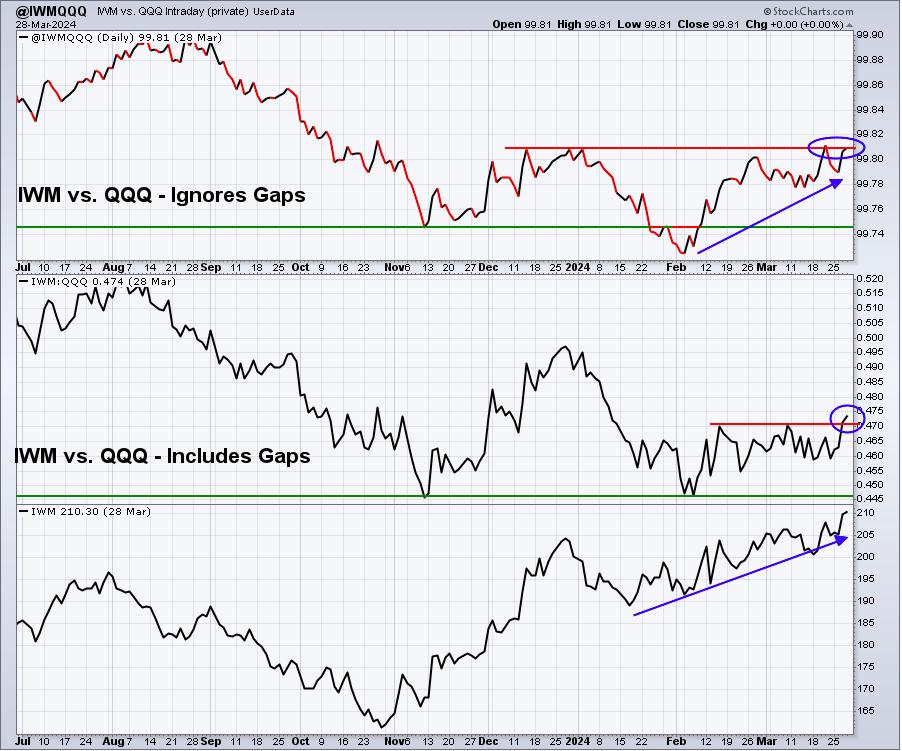
When we see key breakouts in the IWM, the group generally shows relative strength vs. the NASDAQ 100 - at least for several months up to a year. That relative strength sometimes will turn higher at bottoms just before key breakouts. The current pattern seems to be looking very similar to prior periods when the IWM went on a relative tear to the upside. While the IWM has yet to show a ton of relative strength, I created a User-Defined Index (UDI) that tracks the relative INTRADAY performance of the IWM vs. the QQQ (ETF that tracks the NASDAQ 100) and it's currently near its highest level since this huge advance began in October 2023. In other words, current rotation is favoring the small cap IWM, which supports my theory that we'll see outperformance by the IWM over the next few months to a year. Check out this chart:
The IWM has performed well since 2013, but we all have investment decisions to make and we want the BEST performers, or at least I hope that's what everyone else wants. If I'm invested in something that's going up, but underperforming, I feel like I'm leaving money on the table. So if I'm going to overweight an area of the market, I need to see signals that suggest it's a wise move. Right now, the IWM is showing those signals. If and when those signals reverse, then moving back to an overweight position in the NASDAQ 100 makes a ton of sense.
So now that we're finally seeing some relative strength from the beaten-down small cap group, let's review where that small cap relative strength is coming from using an RRG and the Invesco small cap sector ETFs:
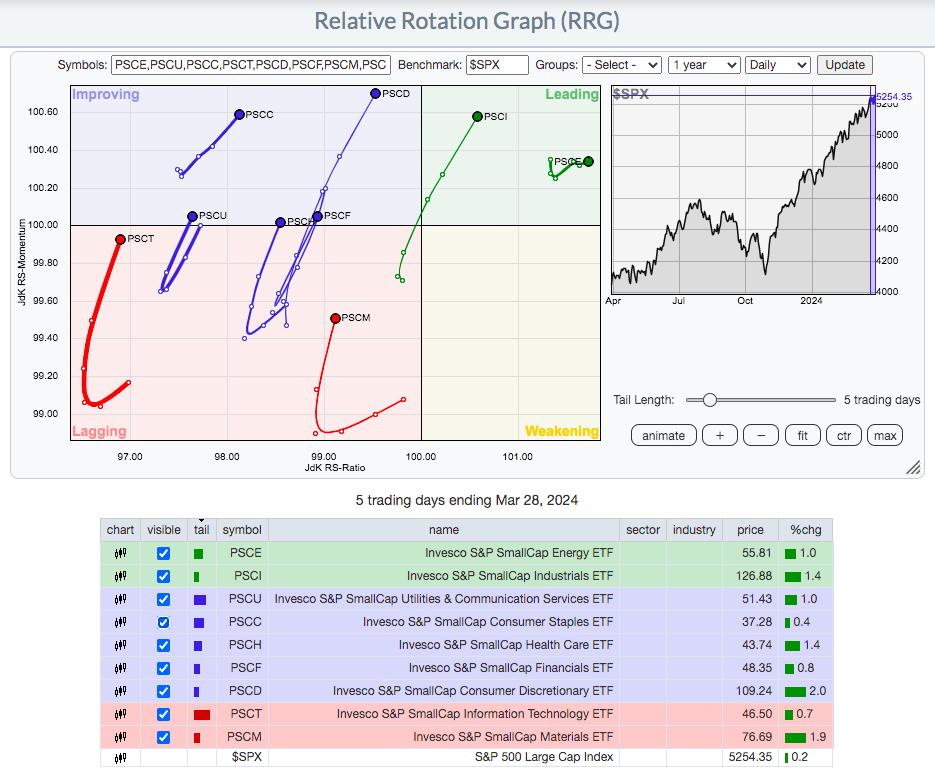
Small cap energy (PSCE) and small cap industrials (PSCI) are the best two small cap sectors right now as they're the only two in the upper right leading quadrant, when compared to the S&P 500. Let's look at both these charts:
Energy (PSCE):
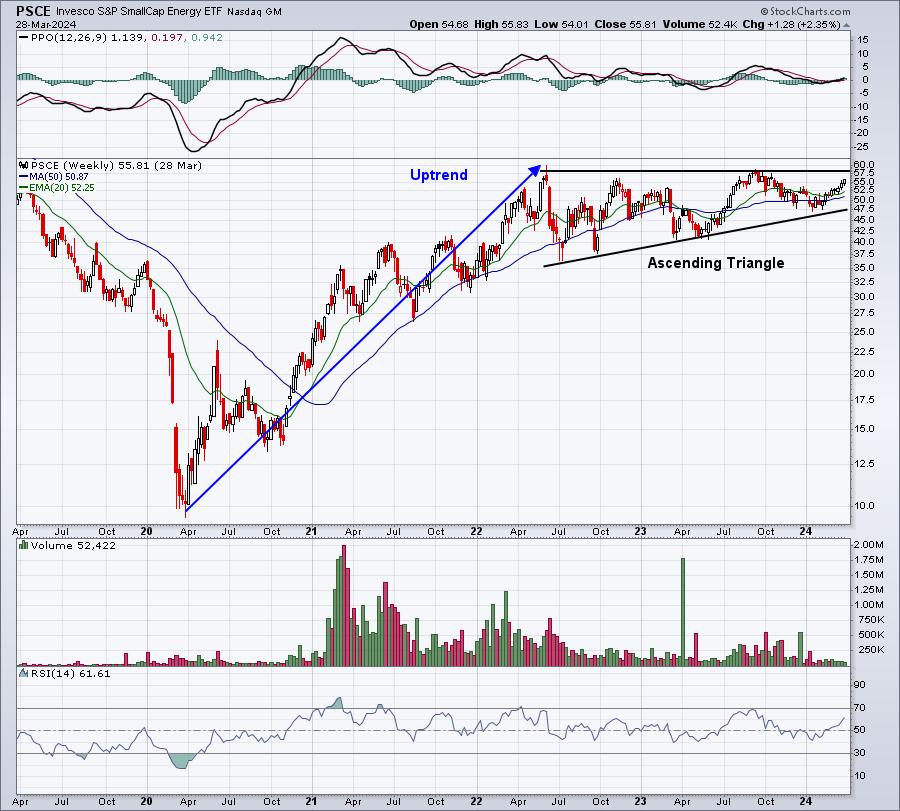
It's hard not to like small cap energy right now, especially inside this bullish ascending triangle continuation pattern. Ultimately, on a breakout, this would measure to 76-77.
Industrials (PSCI):
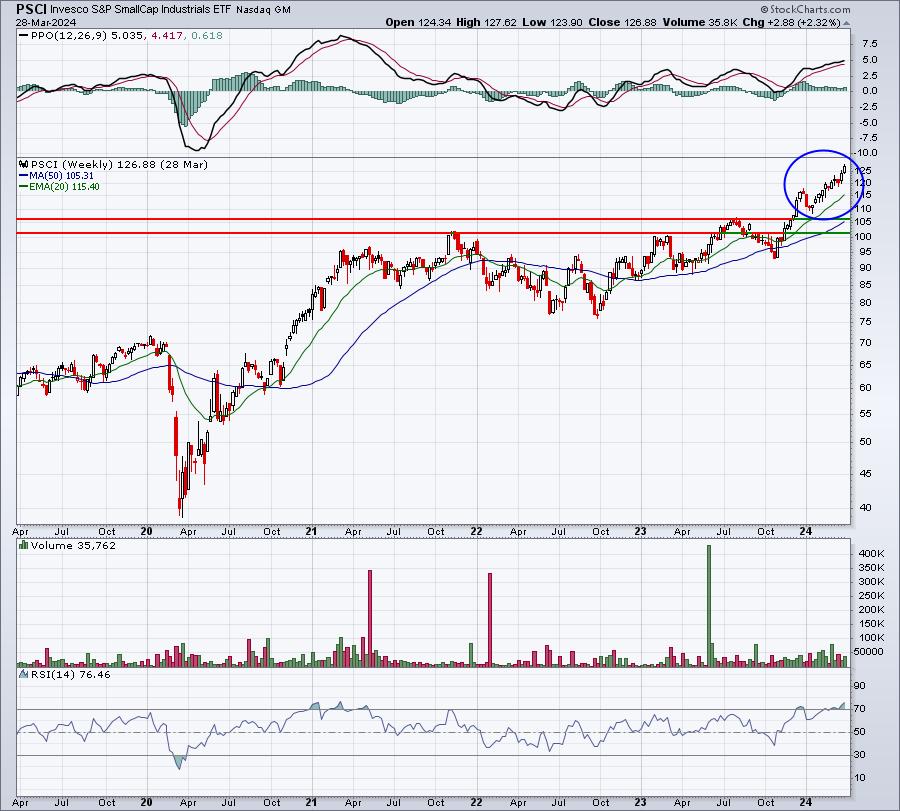
The PSCI has already broken out and looks extremely bullish, especially if small caps, as a whole, continue strengthening.
In my Saturday, March 30th Weekly Market Recap, I discuss many stocks in this space, with several just beginning what appears to be a very strong uptrend. To tune in and watch this Weekly Market Recap video, simply CLICK HERE. If you like the video, please help us out by hitting that "Like" button and subscribing to our channel so that you don't miss future videos. Thanks!
Happy trading!
Tom
