Make absolutely no mistake about it, Friday was the most bearish day of 2024. There was a bearish engulfing candle on MASSIVE volume in the semiconductors area ($DJUSSC), and this group has been BY FAR the biggest single reason why our major indices have advanced as much as they have. Check out this chart:
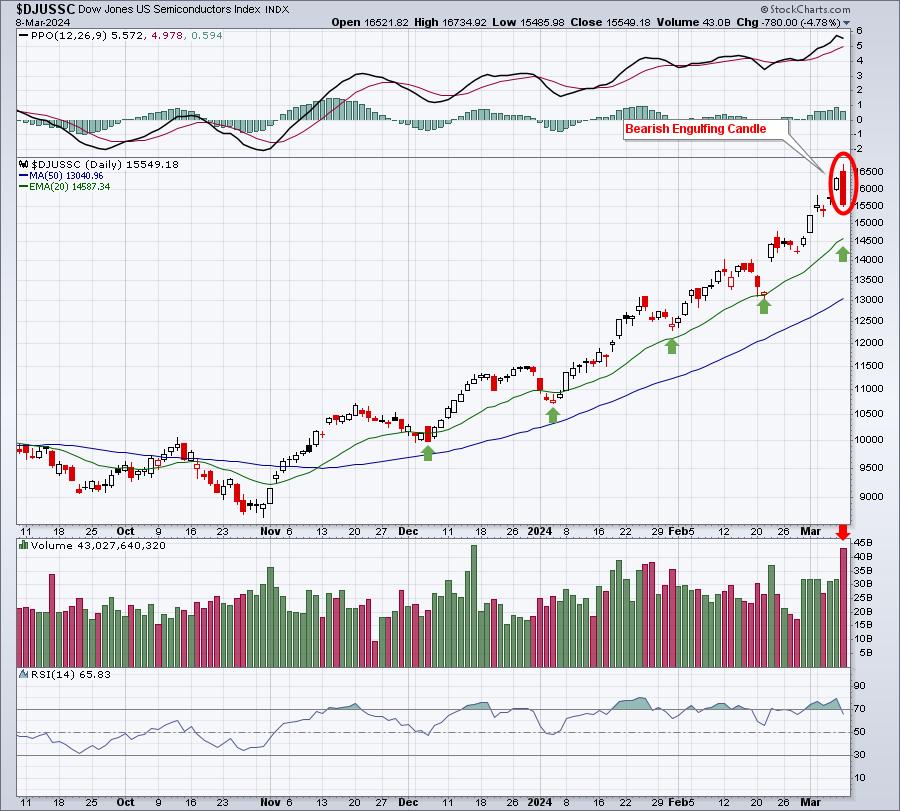
That's a NASTY bearish engulfing candle on the semiconductor chart. And the reversal occurred on the second largest volume of the past 6 months. I believe today's open marked a very significant top on the DJUSSC. That doesn't mean the overall market rally has ended. But I do expect to see other areas of the market lead the next advance. At a minimum, I'd expect at least short-term consolidation or selling among semiconductor stocks. That's not a bad thing, it's a necessary thing. Continuing higher in parabolic fashion would only end in a much more substantial pullback.
But huge rallies do not always end in despair. In fact, most just keep on truckin'!
Let's check to see how the rally off the October 27th low measures up against other periods over the past few decades, first on the S&P 500 and then on the semiconductors index ($DJUSSC):
S&P 500:
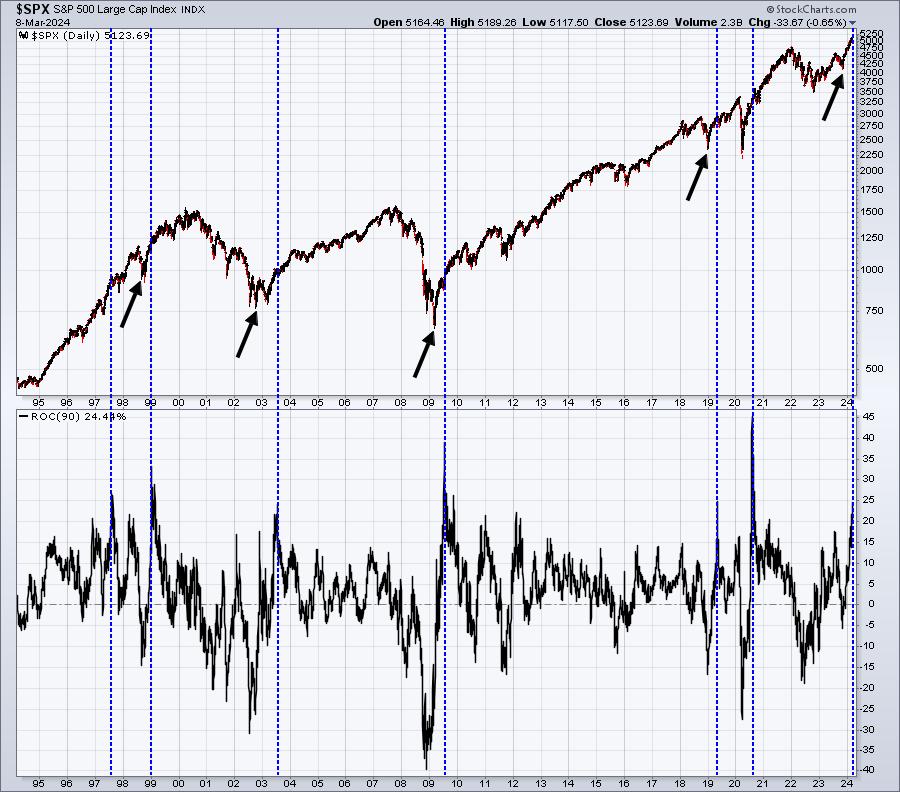
The blue-dotted vertical lines coincide with every 90-day period in which the S&P 500 gains 25% or more. Prior to the current 25% gain in 90 days, you can see that it's only been achieved a handful of other times over the past 30 years. The black arrows tell you that every one of these 25% rallies occurred AFTER a significant bear market bottom or correction low. This is the importance of calling major market bottoms, because the biggest gains take place on the heels of these bottoms.
Next, check out what happens to the S&P 500 after these 25%+ gains are made. It keeps going higher! We are in a secular bull market. If you have been waiting to get into this rally, I'd consider using any short-term weakness to do so. That's my opinion, of course. I'm not a Registered Investment Advisor and, therefore, am not licensed to provide recommendations. I'm simply providing educational materials based on my research. Do with it what you will.
Semiconductors ($DJUSSC):
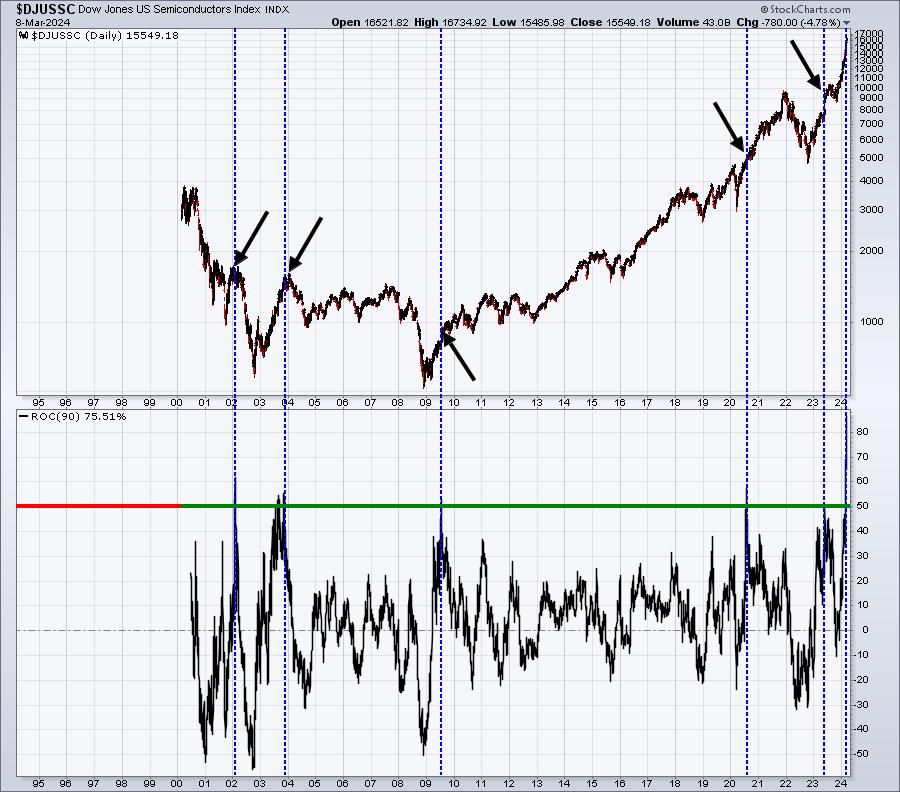
Here, the blue-dotted vertical lines coincide with 90-day periods where the DJUSSC gains at least 50%. Again, this has only happened a handful of times. Right now, the last 90 days has resulted in a gain in the DJUSSC of more than 75%, which eclipses any other semiconductor rally over the past 30 years. The group needs a break.
Should semiconductors stall here, I'm still very encouraged by the small cap asset class. On Monday, I'll be analyzing a tiny software company that this week broke out of a cup with handle pattern on crazy high volume. It potentially could gain 40-50% over the next few months to its pattern measurement. To check it out, you can CLICK HERE to subscribe to our FREE EB Digest newsletter with only your name and email address. I'll send you this tiny software stock on Monday morning.
Happy trading!
Tom
