| |
|
|
|
|
| |

|
ChartWatchers
the StockCharts.com Newsletter
|
|
|
|
|
|
|
|
HOT STOCK(CHARTS) TIPSby Chip Anderson | ChartWatchers Hello Fellow ChartWatchers!
This week, I'm taking time off from our on-going "Technical Analysis 101" series, to enlist your help. We are in the process of compiling a list of "Tips" for using StockCharts.com and we need you to review the tips that we've come up with so far. When this list is complete, we'll make it available to everyone on the website.
Here's our current collection. How many of these did you not know about?
- Members do not see advertising on their charting pages.
- You can give a friend a gift subscription to our site.
- You should never send anyone your credit card information via email.
- When you sign up for 12 months of our charting service, you get an additional month free!
- The Blogs section of the site contains a large number of useful articles and resources.
- You should visit our Status Blog if you suspect our site is having problems.
- You can hear from the President, Chip Anderson, on his blog.
- Our Step By Step blog has easy-to-follow tutorials for accomplishing common tasks.
- You can subscribe to our blogs using any RSS reader.
- Our latest blog articles appear on our home page and the middle of the "Members" page.
- You can set up email alerts for any or all of our blogs.
- Our stock price data is adjusted to remove the effects of splits, dividends and distributions. Learn more here.
- All data adjustments are listed on the Recent Data Adjustments page.
- You can request a new symbol by using our Symbol Request Form.
- We provide charts for Canadian stocks. Their ticker symbols end in '.TO' or '.V'
- If a symbol starts with a $ sign then it is an Index.
- Symbols with the letters EOD in their name are updated once at the End Of the Day.
- Commodity indexes are based on continuous contracts. Click here for details.
- Subscribers can see past daily data by clicking on the "Historical Data" link below any SharpChart.
- We have daily data going back to 1990 for most stocks, indexes and mutual funds.
- Extra members can create intraday charts going back 40 days.
- Extra members can create 60-minute charts going back to mid 2001.
- Our $GOLD index corresponds to a non-tradable "continuous" contract. Click here for details.
- Realtime charts are provided for all US and Canadian stocks as well as many indices.
- We provide up-volume and down-volume information on our site. Click here for details.
- Our data vendors are IDC/Comstock (US stocks) and Thomson Reuters (Canadian stocks and indexes)
- You can search our Symbol Catalog: for all ticker symbols we provide.
- If you need to find a particular ticker symbol check our symbol catalog.
- You can subscribe to our free ChartWatchers newsletter.
- Our free newsletter is called "ChartWatchers"
- Our ChartWatchers newsletter is published on the first and third weekends of each month.
- Our free newsletter is also available in blog format.
- You can often read the blog version of ChartWatchers before the email is sent out.
- Our ChartWatchers newsletter has been published continuously since June 1999. Before then, it was known as "Chip's Charts"
- Our ChartWatchers newsletter contains free excerpts from our Market Message service.
- There are over 50,000 subscribers to our ChartWatchers newsletter.
- ChartWatcher subscribers are notified of upcoming specials and site changes before anyone else.
- We will never send spam to our ChartWatchers subscribers as stated in our privacy policy.
- Each month the top vote getters on our Public ChartList page receive additional free service.
- You can vote for your favorite Public ChartList by clicking "Vote for it" at the bottom of the list.
- You can only cast one Public ChartList vote per day.
- "Hall of Fame" authors have won our Public ChartList vote contest three months in a row.
- Public ChartList commentary is not endorsed by StockCharts.com, Inc.
- You can send messages to Public ChartList authors using the "Send feedback" link on their page.
- Our bookstore contains the best books on charting available anywhere.
- You can order technical analysis books directly from our online bookstore.
- You can buy any of John Murphy's books at our Bookstore.
- We add new books to our bookstore all the time. Click here to see the newest arrivals.
- Our current bookstore special is on our homepage under the "What's New" area.
- Our ChartWatchers Book Bundle contains the 5 most popular technical analysis books at a huge discount.
- We work on any computer that runs an Internet browser including Mac, Windows and Linux computers.
- We recommend that you use the Mozilla Firefox browser if possible.
- Your browser should be configured to accept all cookies from StockCharts.com.
- Your spam filters should be set to accept all emails from StockCharts.com.
- Members can access their StockCharts.com account from any Internet connected computer.
- We recommend using a video resolution of 1024p wide or larger.
- If you are seeing out-of-date charts, clear your cache and reboot your computer. Click here for details.
- We offer a number of predefined scans for you to access.
- Our predefined scan pages are updated about an hour after the market closes.
- Extra members can create and store scans inside their account.
- Extra members can access the Advanced Scan Workbench.
- You can send us questions 24/7 using our Support Request form.
- If you are new to Technical Analysis check out our series Technical Analysis 101.
- You can view all our support documentation here.
- If you have a question, check out our FAQ.
- You can view all our membership policies here.
- Our support team is most responsive to questions during the hours of 9:00am to 11:00am Eastern time.
- Check you spam filter if you don't hear back from us within 24 hours of sending in a support request.
- You can check our status blog if you are having trouble with the site.
- You can request a missing ticker symbol using our Symbol Request form.
- We support the Company-Customer Pact.
- Our top support issues can be found at the top of the FAQ page.
- The support team responds to over 1000 support requests each week.
- Over 85% of our users feel the support team answers their question satisfactorily.
- We provide a glossary for different technical analysis terms.
- You can add a moving average to volume on a SharpChart. Click here for details.
- Extra members can save annotated SharpCharts into their account. We then keep the annotation up-to-date automatically.
- Basic Subscribers can add 8 indicators and overlays per SharpChart.
- Extra members can add up to 24 indicators and overlays per SharpChart.
- Extra members can create SharpCharts that are up to 1600 pixels wide
- You can create a Ratio SharpChart by separating two ticker symbols with a colon character (i.e., "ibm:$spx")
- If the previous closing value is less than or equal to the current closing value, we draw the current candlestick in black.
- If the previous closing value is more than the current closing value, we draw the current candlestick in red.
- A yellow highlighted bar on the right side of a SharpChart represents delayed price data for the current time period.
- You can add more horizontal space to the right side of a SharpChart using the "Extra Bars" box.
- You can overlay one SharpChart on top of another. Click here for details.
- We track several Market Breadth Indexes which are often viewed cumulatively such as $NYAD. Click here for details.
- We provide the Record High Percent Index.
- To add another dataset to your charts use the Price indicator.
- You can remove the numbers in the upper left corner of a SharpChart by unchecking the "Show Legends" box in the Chart Attributes area.
- You can create a reciprocal chart. Click here for details.
- You must click "Linkable Version" before you can bookmark a SharpChart. Click here for details.
- The blue dashed line on intraday charts represents the closing vale for the previous day.
- You can learn what the different Candlestick colors represent in this Mailbag article.
- You can display full quote details for a stock by checking the "Full Quote" box in the Chart Attributes section.
- Everyone has access to all indicators and ovelays we provide regardless of their subscription level.
- You can view descriptions of all indicaotrs and overlays we provide here.
- You can email a SharpChart to a friend by clicking the "Send" link just below the chart.
- The best way to print a SharpChart is to click the "Print" link just below the chart.
- Subscribers can select 1,5,10,15,30 and 60 minute SharpChart periods as well as daily, weekly and monthly.
- Most SharpChart indicator and overlay parameters are based on the chart's "Periods" setting.
- "Price Labels" are small flags with price data at significant highs and lows of a SharpChart.
- "Fill-the-Chart" mode will fit as many correctly-sized price bars as it can into the SharpChart's price plot area.
- Extra members can create StyleButtons that can access important ChartStyles instantly.
- You can add trendines to any SharpChart. Click here for details.
- Our ChartNotes Annotation Tool allows you to add trendlines, text, arrows, Fibonacci retracement lines, and much more to any SharpChart.
- Holding down the CTRL key while drawing Fibonacci Retracement lines will add Fibo extentions to your SharpChart.
- To add annotations to a SharpChart, click on the "Annotate" link just below the chart.
- You can use the ChartNotes annotation tool to inspect any data point on a SharpChart with your mouse.
- You can see price data for any SharpChart by clicking the "Annotate" link and then mousing over the price bars.
- If you want to save annotated SharpCharts in your online account, you need to be an Extra subscriber.
- You can add filled rectangles and circles to SharpCharts by holding down the CTRL key while dragging out a circle or rectangle shape in ChartNotes.
- You can resize a "callout box" by clicking on the callout box and then dragging the yellow handles that appear.
- SharpChart annotations can be drawn in any of 16 different colors.
- You can change the width of an annotation line by using the"Line Width" toolbar.
- You can change the font for text or callout box using the "Style" toolbar.
- On P&F charts, the numbers 1 - 9 and the letters A, B, and C appear in the first box filled during the corresponding month.
- On P&F charts, the letters A, B & C correspond to the months October, November, and December.
- StockCharts provides two different techniques for calculating P&F Price Objectives.
- You can check for stocks with a P&F Pattern on our Pattern Alert page.
- We provide graphical, text and dynamic views for P&F charts.
- P&F Price Objectives are notoriously unreliable.
- On a P&F chart, "PO" represents the Price Objective marker.
- Trendlines on P&F charts are always drawn at 45 degree angles.
- Unlike on bar charts, chart patterns on P&F charts can be reliably detected by computers.
- We don't currenty support annotations for P&F charts.
- The widespread use of P&F charts predates the widespread use of Bar and Candlestick charts.
- A P&F Reversal Marker marks the level that the price would need to reach in order for a reversal to occur.
- Each column on a P&F chart corresponds to an uptrend or downtrend section on a traditional bar chart.
- All of our Bullish Percent Indexes have ticker symbols that start with "$BP".
- Bullish Percent Indexes, calculated from large numbers of P&F
- You can see all of StockCharts.com's major milestones here.
- StocCharts has been around for more than 10 years.
- StockCharts has over 21,000 subscribers.
- We currently track over 900 different indexes in our database.
- We track over 33,000 different ticker symbols and we add up to 200 new ones every day.
- Our ScanEngine contains 800 daily data points for each of the 30,000+ different stocks, indices, and mutual funds that we track.
- StockCharts provides market commentary from two of the best technical analysis writers, John Murphy and Arthur Hill.
- John Murphy was the chief technical analyst for CNBC.
- John Murphy is the author of several best selling books including Technical Analysis of the Financial Markets.
- John Murphy received a bachelor of arts in economics and a master of business administration from Fordham University.
- The Market Message provides video and audio tutorials.
- Some days we publish multiple Market Messages. Occasionally, we will skip a day if the market doesn't do anything worth commenting on.
- Market Message subscribers get access to Arthur Hill's "Arts Charts" blog which is updated several times a day.
- Market Message subscribers get access to new market analysis videos about 3 times a week.
- John Murphy typically talks about inter-market analysis (stocks,bonds,commodities and currency).
- Our chief technical analyst, John Murphy, has been called the "Father of technical analysis."
- Arthur Hill wrote much of the content in ChartSchool.
- John Murphy wrote Ten Laws of Technical Trading.
- We provide a bundle of John Murphy's books in our bookstore.
- John Murphy's latest book is an update to The Visual Investor.
- Market Message subscribers can view archived Market Messages going back to 2003.
- Market Message subscribers can send questions or comments to John Murphy and Arthur Hill using the comment box at the end of every Market Message post.
See any that are confusing? Any typos? Know of any good tips that we left out? Let me know in the comment area of the ChartWatchers blog. Happy Holidays!
- Chip P.S. Don't forget about our Holiday Special going on right now. It's going to end later this month so don't delay! BOND YIELDS AND DOLLAR BOUNCEby John Murphy | The Market Message Sometimes good news produces a
bad effect. That's especially true when dealing with financial markets.
Today's unemployment report dropped to 10% and payrolls fell by an
unusually small amount. That good news was given a positive reception
by most markets. By day's end, however, commodities and stocks were on
the defensive. The good news caused a big jump in the 10-Year T-note Yield
(Chart 1) as bond prices fell sharply. The jump in bond yields (and a
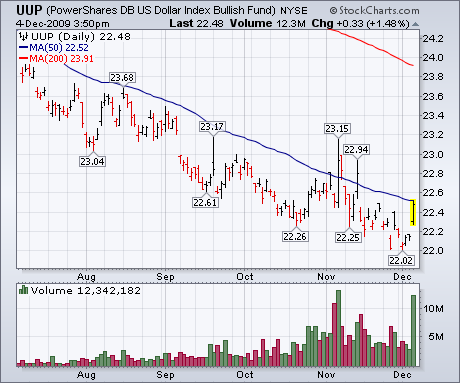
more positive view on the U.S. economy) pushed the dollar higher. Chart
2 shows the Power Shares Dollar Bullish ETF (UUP)
surging 1.5% on the heaviest volume in two months. The UUP is now
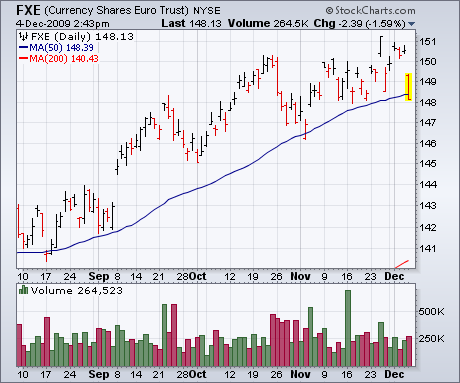
challenging its 50-day moving average. Chart 3 shows the Euro
(which trends in the opposite direction of the UUP) falling below its
50-day moving average for the first time in several months. The rising
dollar caused profit-taking in commodities, and gold in particular. 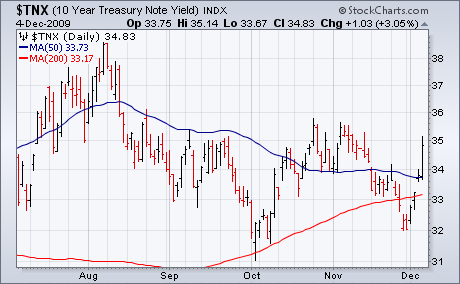
FINANCE SECTOR STILL LAGGINGby Arthur Hill | Art's Charts The finance sector continues to underperform the overall market. While the S&P 500 and Dow are consolidating near 52-week highs, the Financials SPDR (XLF) remains well below its October high and shows relative weakness. The bottom indicator contains the price relative, which is the XLF:$SPX ratio. XLF is outperforming when the ratio rises and underperforming when the ratio falls. Notice that the ratio peaked in October and declined to its lowest levels since late July. XLF is clearly underperforming the S&P 500. 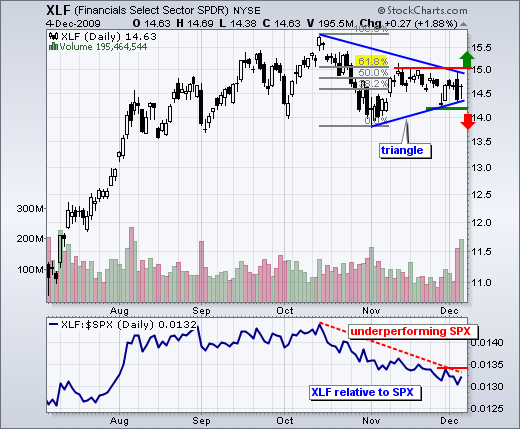 Click this chart for details. On the price chart, XLF formed a triangle consolidation over the last eight weeks. Prior to this triangle, the ETF advanced from July to October. While this triangle can be considered a consolidation within an uptrend, the next signal is dependent on the triangle resolution. A break above 15 would be bullish, while a break below 14.2 would be bearish. The market is likely to follow in the direction of this triangle break. EXPECTING UPSIDE BREAKOUTby Carl Swenlin | DecisionPoint.com
On Thanksgiving Day Dubai announced that it would be delaying loan
payments by six months. This resulted in a global selloff, in which the
U.S. markets participated on the following day. There was virtually no
follow through selling this week. Looking at the S&P 500 chart
below, you can see that the Dubai selloff is practically invisible
within the context of the trading range of the last several weeks.
In fact, the market is consolidating during a time when I had
expected it to be declining into the 20-Week Cycle low. Because of this
I have had to reconsider my cycle assessment: It appears that the
20-Week Cycle low occurred on November 1, about three weeks ahead of
schedule. Early or late arrival is a frequent occurrence, but not
something we can know until after the fact. All we can do is adjust
accordingly. At this point, I think a new 20-Week Cycle began on
November 1. The next major cycle-related correction low is projected
for April 10, 2010 when the 9-Month Cycle is due to bottom. 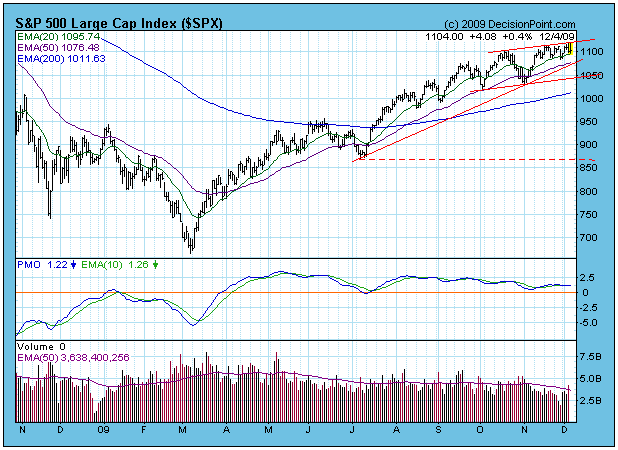
Let's look at the chart again. What I see is a flag pole (the rally
from the November low) and flag (the recent three-week consolidation).
The technical expectation from this formation is an upside breakout
with an initial target of about 1180. We are in a bull market with the
market behaving extremely well, so I have high confidence in this
outlook. If prices drop below the bottom of the flag, breakout
expectations would be negated. Next is a monthly chart of the S&P 500, and it contains some
very bullish evidence. The monthly PMO (Price Momentum Oscillator) is
rising off a very oversold reading (lowest since 1932), and it has
crossed up through its 10-month moving average. There are only four
other deeply oversold PMO bottoms since 1929, and all were associated
with new bull markets. Four data points in 90 years is a thoroughly
inadequate statistical base from which to draw conclusions, but,
understanding how the PMO works, I think the bull market is likely to
continue for at least a year and could easily challenge previous
all-time highs. Be advised, however, the positive long-term picture
does not eliminate the possibility of substantial corrections along the
way, but a smoothly rising monthly PMO presents a solidly positive
long-term technical picture. 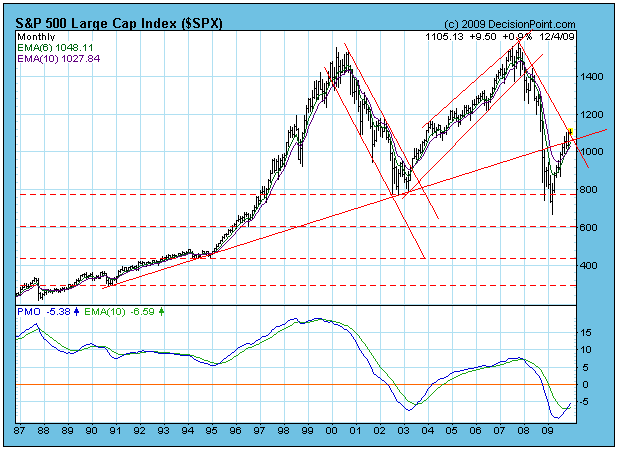
Bottom Line: Technically, the market is showing solid strength, but the
bull market is running strictly on speculation and emotion, and there
is virtually no fundamental support under the market. The Dubai event
is a good example of the kind of thing that has the potential to start
an avalanche of selling. There are probably hundreds of them waiting in
the bushes. Taken one at a time, they may only cause a momentary
ripple. If too many pop out at one time, it could end in disaster.
OIL SERVICES READY TO RUN?by Tom Bowley | InvestEd Central When I see a relationship in the market that tends to hold true over time, it always peaks my interest when the market varies from that "norm". That seems to be the case right now with oil services stocks. Generally speaking, when oil prices rise, money flows to oil services stocks relative to the S&P 500. Likewise, when oil prices are on the decline, I expect to see oil services stocks struggle. Take a look at the following chart to see the relationship that exists between the direction of oil prices and the relative performance of oil services stocks: 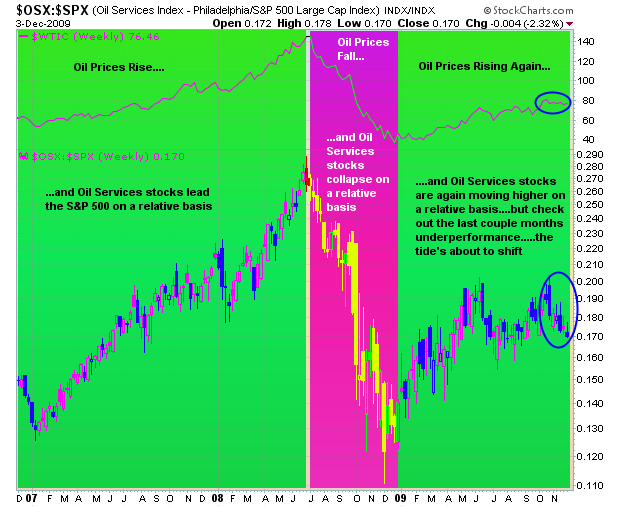
Notice how oil services stocks have fallen quite a bit on a relative basis in the last two months? Crude oil has ticked a little lower, but not enough to cause oil services to drop so much. I believe this skewed relationship will resolve itself in time by oil services stocks outperforming. Time will tell.
Some wonder why oil prices aren't following gold prices higher. After all, the dollar continues to weaken and gold is benefiting, why isn't oil? Personally, I believe there are other influences at work in taking gold higher. Gold is a hedge against a weak dollar, inflation and deflation. Right now, we have folks in all three camps. It seems that everyone wants to own gold and we can't fight the tape. Let's get back to oil and the dollar for a moment. Oil has benefited from a weak dollar. Oil has roughly doubled during 2009. That increase is partly due to an improving economic picture, but the weaker dollar has contributed as well. My view is the dollar will remain under pressure for the foreseeable future and that will only aid crude oil and oil services stocks. The market overall continues to gyrate back and forth. The major indices have edged mostly higher over the past couple months, but rotation has been the name of the game. No one sector - other than gold and perhaps healthcare - has been able to maintain a consistent uptrend since the May/June highs. That has left us with a mostly trendless market where timing is critical, both at the sector and individual stock level. Everyone must remain patient in a market like the one we've been in for last few months. I like to focus exclusively on low risk, high reward trade candidates while in this type of market environment. Trade fewer shares and be willing to accept smaller profits. Otherwise, profits evaporate as sectors rotate. Another requirement to profitable trading in this environment is to keep stops in place. Small losses don't hurt much, but big losses are hard to recover when the market is essentially trendless. Feel free to check out my Chart of the Day at Invested Central. I scan for stocks that fit the description above and provide annotated charts and a brief analysis every day as educational reinforcement. CLICK HERE to check it out. Happy trading! |
|
|
|
|
|
|
|
|
|
|
|
|
|
|