|
It’s been an exciting week in the stock market. Just when we thought things would go south, the broader equity indexes rebounded, with most trying to reach previous highs. But it wasn’t just equities that rallied; Gold rebounded, the US dollar rose, and Bitcoin skyrocketed.
It’s great to see the value of your portfolio growing, but, at the same time, you have to watch the market for any changes that could dampen the rising euphoria. There’s a shift in interest, which can clearly be seen in equities. Presently, investors are rotating out of the mega-cap tech stocks and into small and mid-cap stocks. You can see this rotation take place when you view the Sector Summary Dashboard Panel, but you can also do a deeper dive with the RRG Charts.
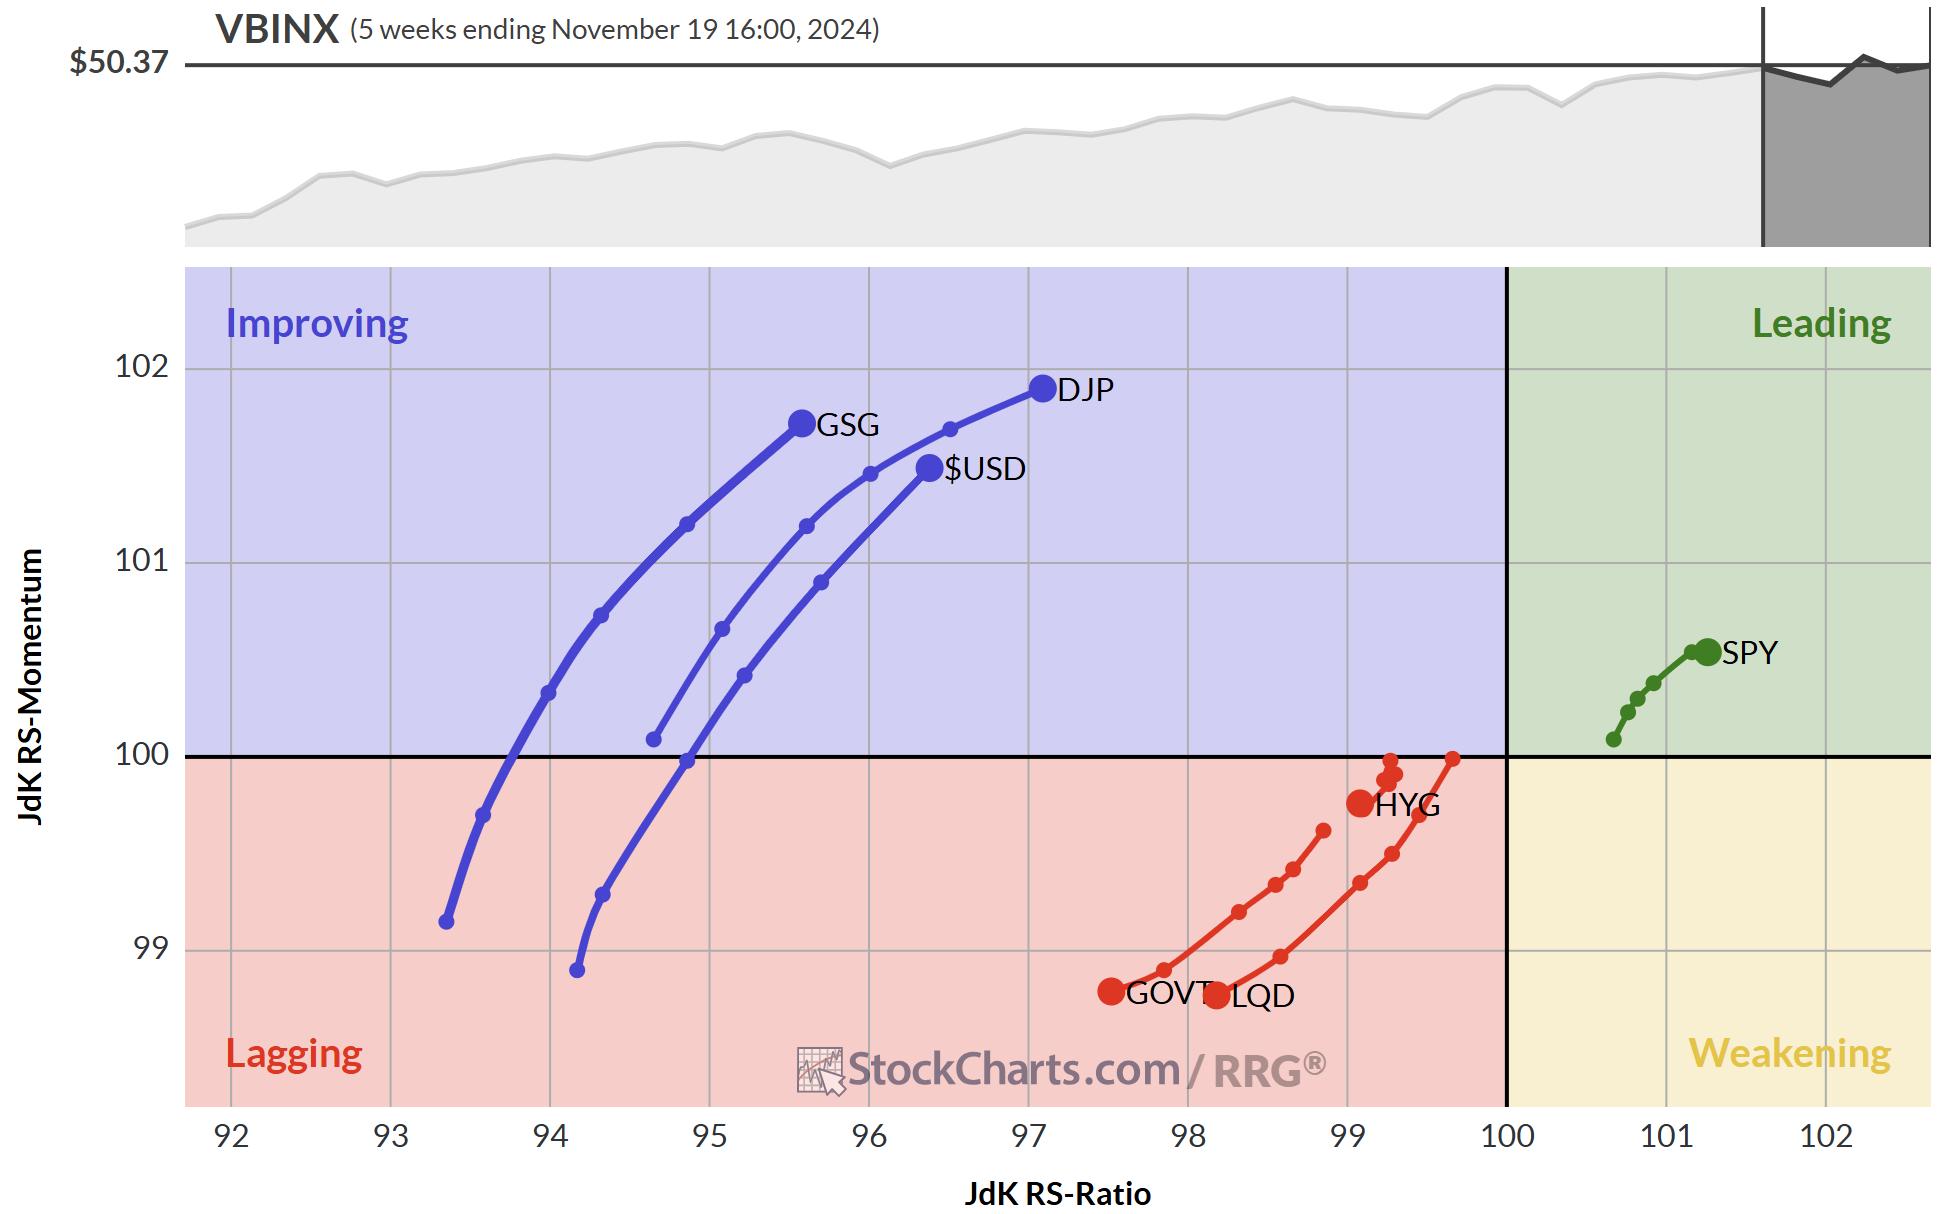
RRG Charts give you a visual view of the overall market and different asset classes within the market. With RRGs, you can quickly perform a top-down analysis and identify which stocks and ETFs to consider. If you haven’t used RRGs recently, you should take a new look; recent improvements from our team here at StockCharts have made RRGs better than ever.
How to find RRG: From the Your Dashboard page on StockCharts, click the arrow to the right of Charts & Tools, then select RRG Charts. If you select the S&P 500 Sector ETFs from the Group menu and check the Arrow mode button, you’ll quickly see which sectors are improving, lagging, leading, and weakening. When I looked at this RRG chart on Friday after the close, one thing that stood out was the Technology sector moved from the Improving quadrant to the Lagging one. The leading sectors were Consumer Discretionary, Financials, Industrials, and Communication Services. Consumer Discretionary stood out as the leader.
The nice thing about RRG Charts is that you can dive into each sector and see which stocks within the sector are leading or lagging. In this case, select XLY members from the Group menu and you’ll see which ones are leading. Plus, you can animate the charts to see how the different indexes, sectors, ETFs, or stocks move from one quadrant to another. It’s a pretty nifty tool that can get addictive. Check it out!
And here’s a heads-up. Be on the lookout for emails from us about our special end of year sales next week.
|


