|
When the stock market is trending higher, it’s easy to get caught up in the euphoria. At some point, it becomes difficult to accept that the market will go in any other direction. This is why it’s important to always look at charts, starting with the broader market indexes.
Jesse Livermore, one of the greatest stock traders, insisted on identifying the market’s direction by looking at the line of least resistance. This could be a trendline, moving average, price channel, or any other trend identification indicator.
In essence, when the market, sector, or stock is aligned with an upward movement of the line of least resistance, you should take advantage of it. However, once that line stops moving higher, know that a change lies ahead.
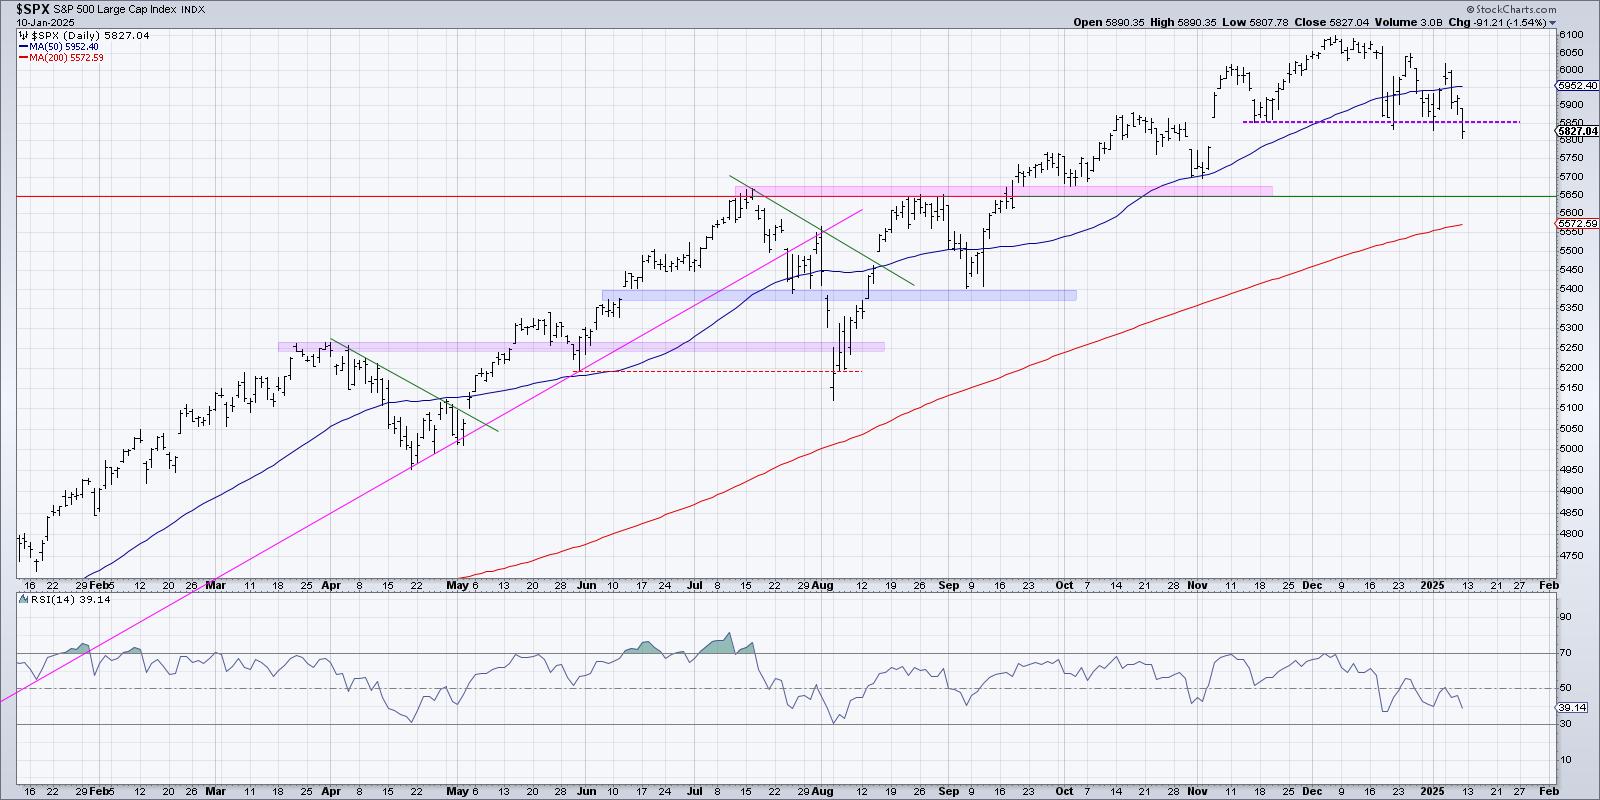
This week, the stock market displayed price action that suggests that the uptrend may be taking a pause. The broader stock market indexes are either at key support levels or showing signs of correcting. This is especially evident in the small-cap stocks, which tend to be more interest-rate sensitive. This chart shows that after crossing below its 50-day moving average (MA), the S&P 600 Small Cap Index traded within the green-shaded trading range. After breaking below that range, the index fell to its 200-day MA. It’s still holding that support, but a break below the 200-day MA would mean a change in direction.
Monitor this chart by adding it to your StockCharts ChartLists. You can add several other charts and scroll through them regularly to stay abreast of the market. It helps to develop a routine, and, more importantly, it also reduces emotional decision-making. And that’s a huge step in becoming a smarter investor.
|


