|
It was quite an event-packed trading week, with the DeepSeek news immediately putting the market on a slippery slope. Despite that shock to the system, things recovered, helped by mega-cap tech earnings. Next was the Fed meeting, which went as expected with no big surprises.
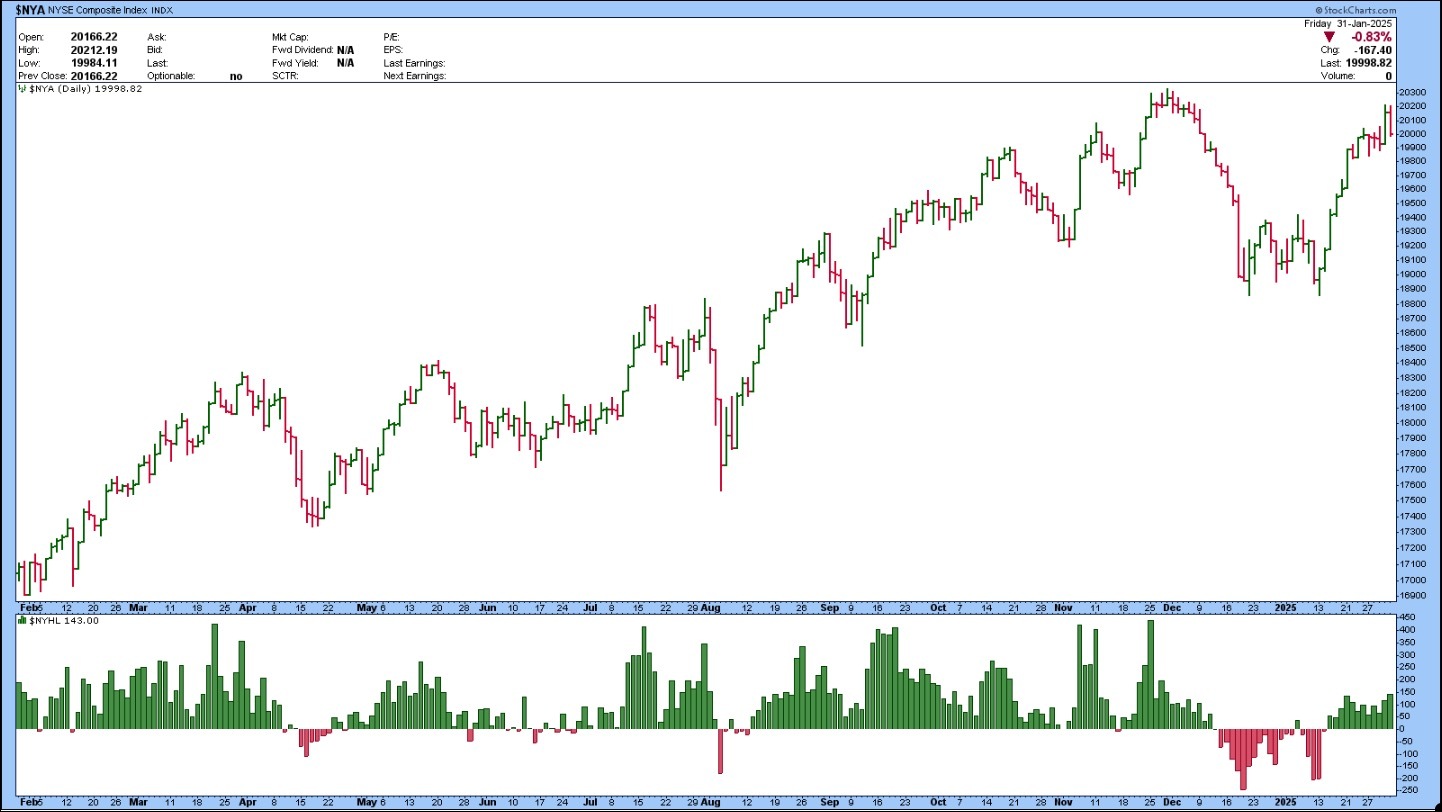
Then Friday rolled along and, although it looked like the market would finish on a strong note, the apparent confirmation of high tariffs shifted the narrative and sent the broader markets into selloff mode. For now, though, market breadth is still holding on. The chart below shows the NYSE New Highs are greater than the New Lows, indicating the uptrend is still holding on.
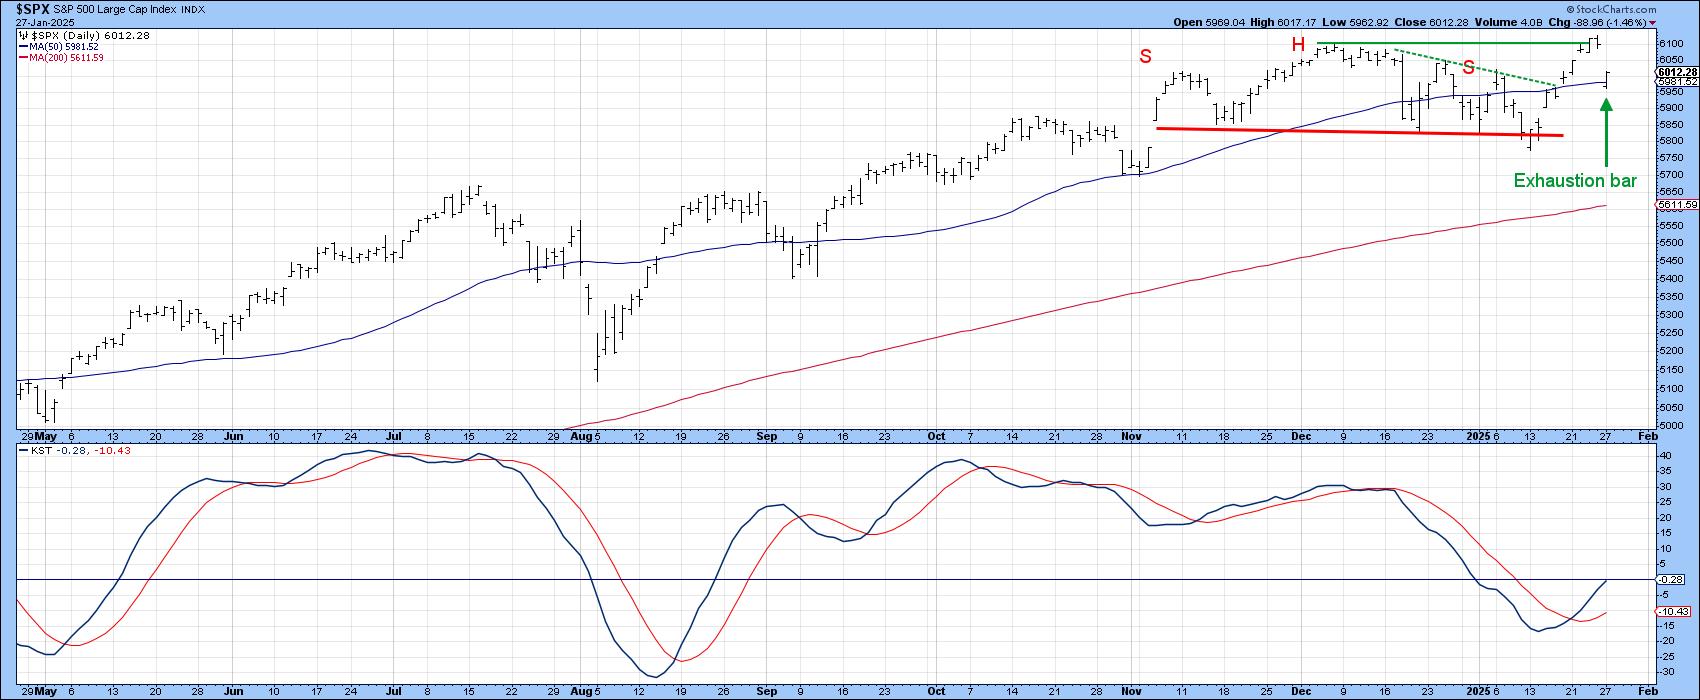
Despite the volatile moves, the S&P 500 closed higher by 2.70% for January. According to the Stock Trader’s Almanac, a strong January points to a strong year. This doesn’t necessarily mean investors should be complacent, however.
The unfolding of events in January indicates how volatile the market can get, especially as the new administration gets underway. Any news release can quickly change investor sentiment and impact the market’s price action. If investors focus on the news to make investment decisions, there’s a greater probability of making irrational decisions. Instead, shut out the noise and focus on the charts.
Identifying investment-worthy stocks requires objective analysis. How you do your analysis is dependent on your needs and goals. StockCharts has several tools that simplify chart analysis. For a good example, scroll through our Sample Scan Library, think of what criteria are important for you, and find a scan that closely aligns with your needs.
Here’s an article that walks you through how to use the “Outperforming SPY: 3-Month Relative Highs” scan. This scan identified two promising stocks. Try it out and see what shows up when you run the scan.
As you can see, this is just one of the many scans available on the StockCharts platform. Once you find a few that work for you, make them a part of your daily routine. Stocks fall in and out of favor all the time and, as soon as one doesn’t work for you, be prepared to ditch it.
The +1: Did you know you can save the scan results to a ChartList? Click the green Save to ChartList button. You can also download the results as a CSV file by clicking the Download CSV button.
|