|
This week’s market action was similar to last week’s, meaning up in the early part of the week but selling off at the end. This is a very news-driven market, one that reacts to news about anything that will trigger or ease fears. And this week, the stock market was driven by earnings, inflation fears, and tariffs.
- Tech earnings sent individual stocks higher or lower, depending on quarterly earnings or guidance.
- The University of Michigan consumer survey, which came out on Friday, showed that consumers expect inflation to rise one percentage point a year from now. This is a significant rise. The last time we had this high a reading was in November 2023.
- President Donald Trump said he would announce reciprocal tariffs next week.
That’s quite the trifecta!
While earnings were stock-specific, tariff and inflation worries sent stock prices sliding. The S&P 500 ($SPX), Nasdaq Composite ($COMPQ), and Dow Jones Industrial Average ($INDU) closed the week lower, but not by a significant amount.
So what’s an investor to do when the stock market keeps chopping up and down? Keep calm and focus on the long-term picture.
The weekly chart of $SPX below shows that the overall trend of the index is still up. The index is trading above its upward-sloping 50-day simple moving average (SMA). More interesting is the McClellan Summation Index displayed in the panel below the price chart. It may be a lesser-used indicator, but the McClellan Summation Index can be your wingman, especially during choppy times.
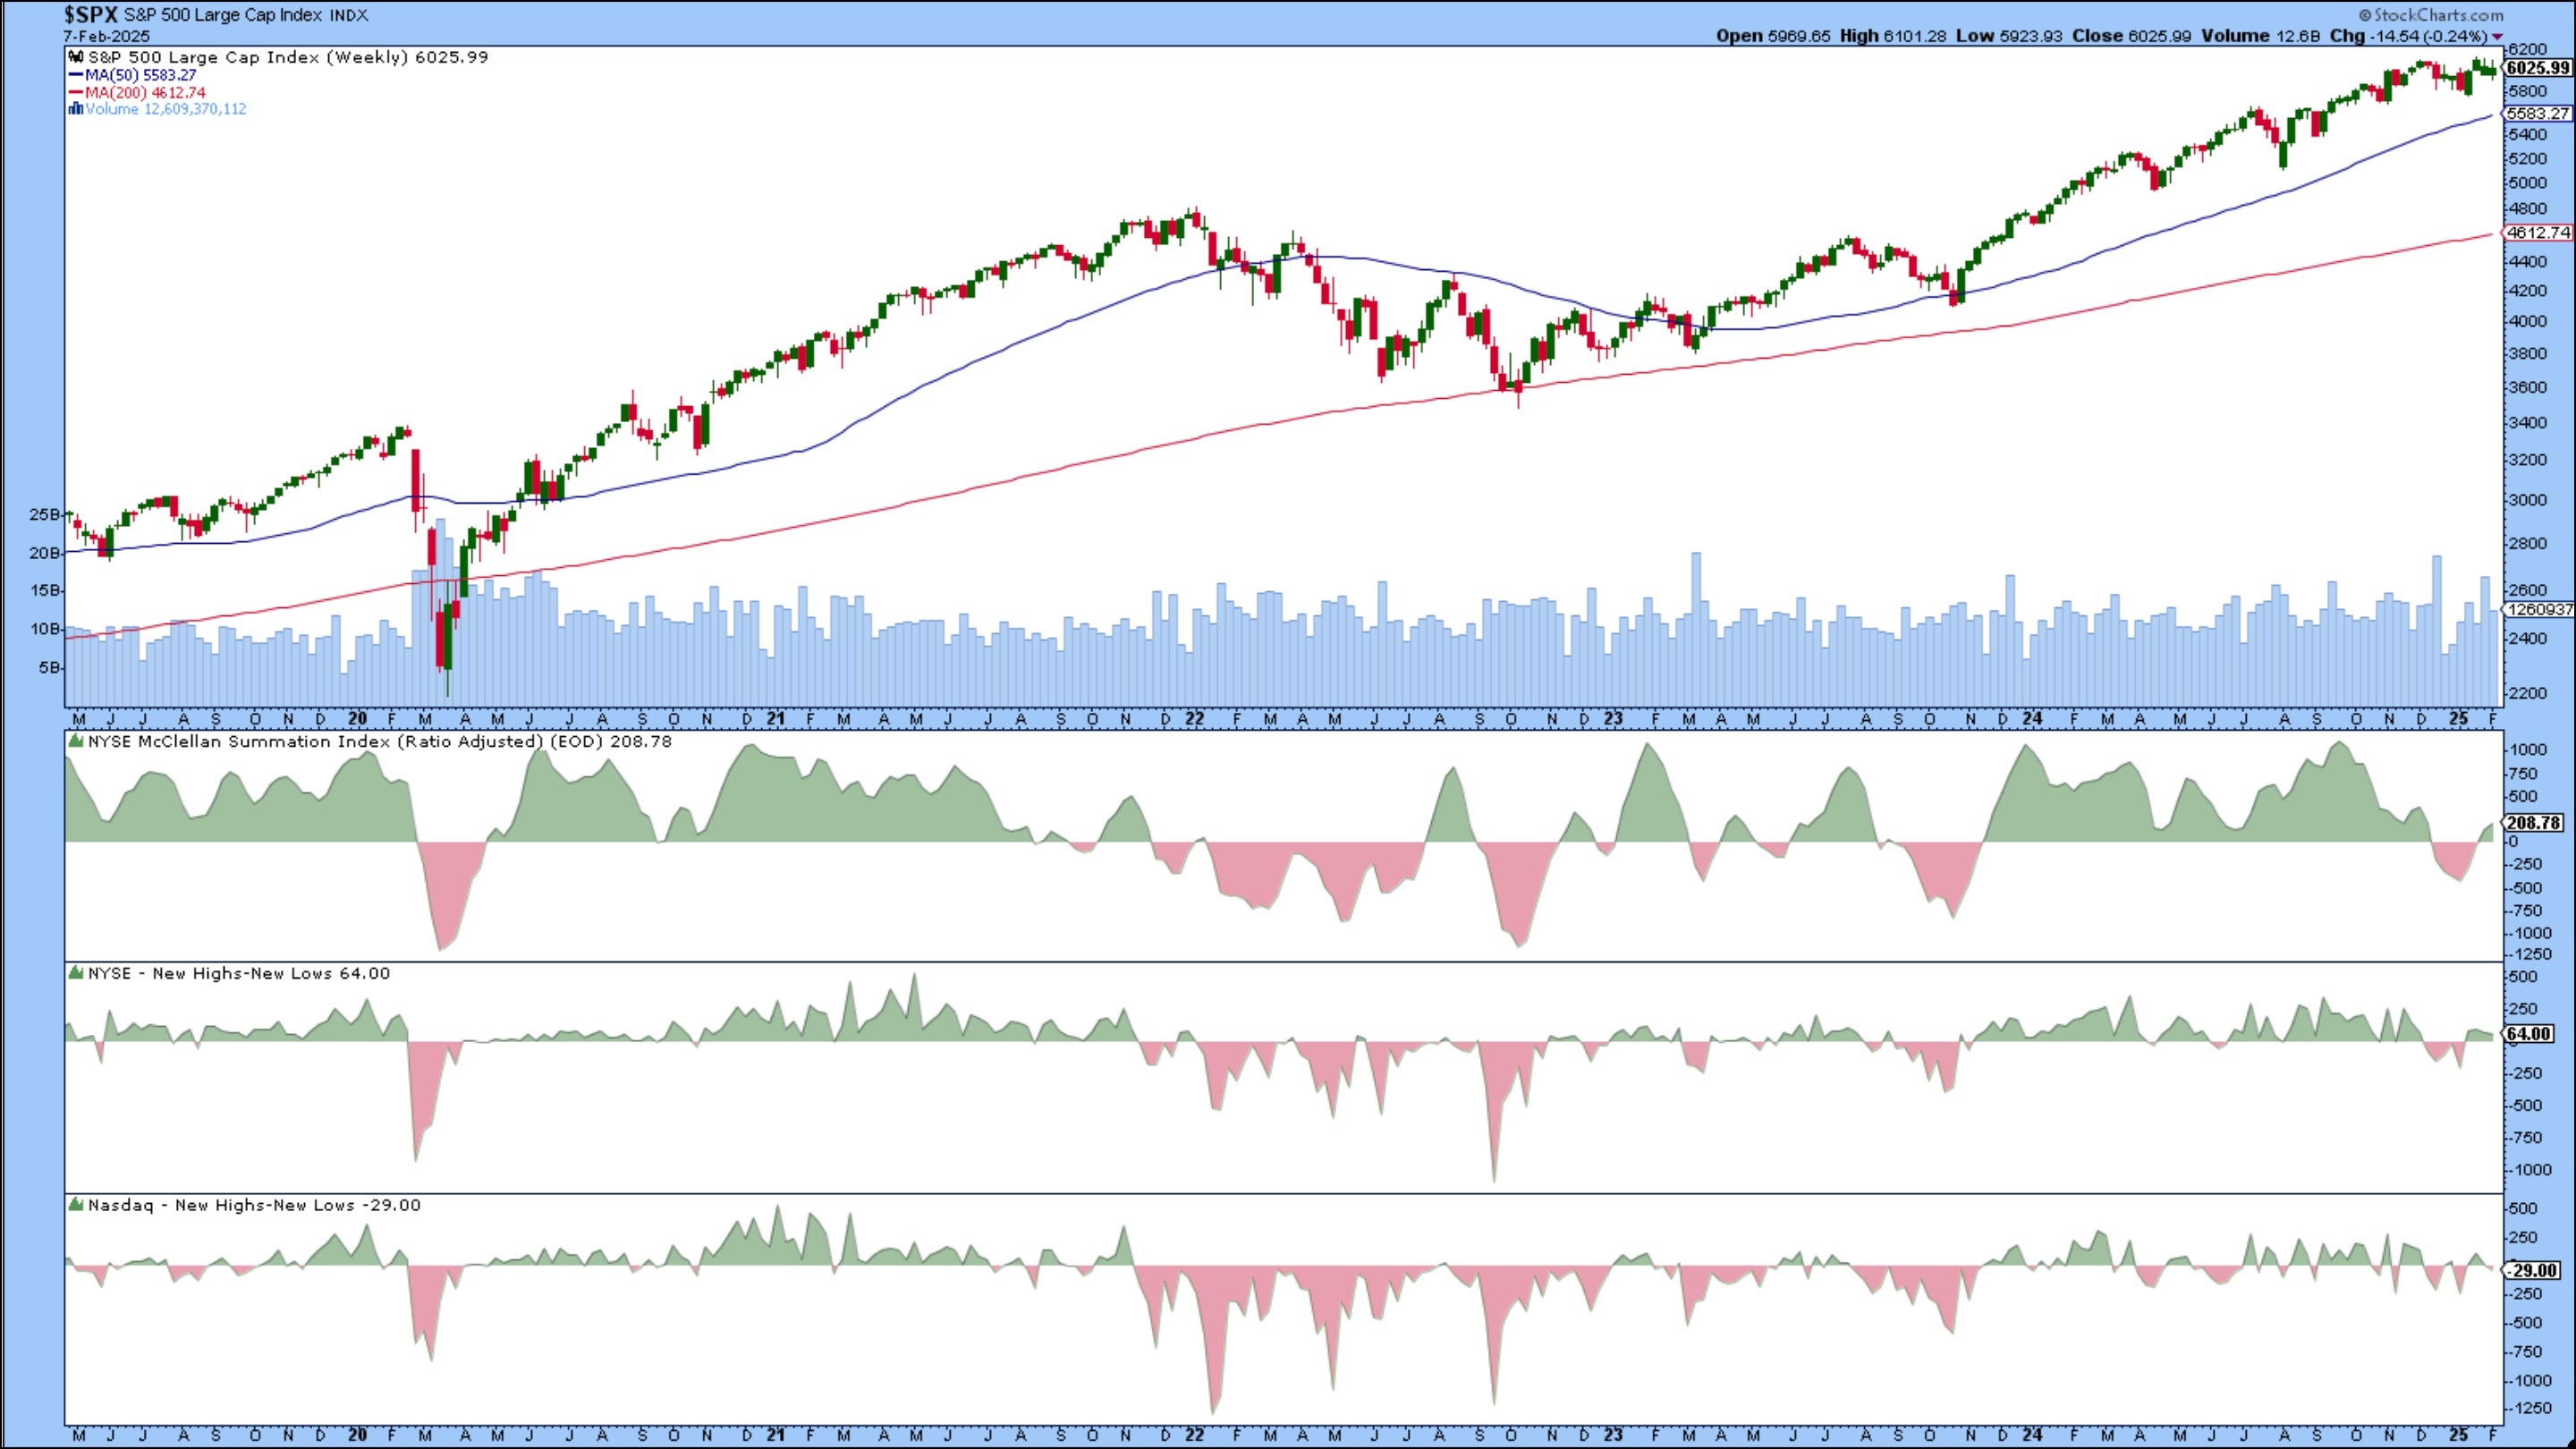
Note the depth of the dip in the McClellan Summation Index in early 2022, and then again from September to November of the same year. These dips in negative territory coincided with the S&P 500 approaching its 200-day SMA.
A dip of a similar magnitude occurred in late 2023 when the S&P 500 dropped to its 50-day SMA. Compare these dips to the recent one from December 2024 to January 2025. The pullback wasn’t as drastic and the S&P 500 didn’t come close to its 50-day SMA. The McClellan Summation Index is in positive territory, despite the choppiness, and the S&P 500 is still holding on to its bullish trend.
You get a similar picture from the NYSE New Highs - New Lows and Nasdaq New Highs - New Lows indicators (see lower panels). The negative moves in these indicators were much more drastic when the S&P pulled back to its 200- or 50-day SMAs versus what is occurring now. The new highs outnumber new lows in the NYSE, whereas in the Nasdaq, the new highs are slightly lower than the new highs.
The bottom line: The S&P 500 is not flashing any distress signals, so keep calm and watch the Eagles and Chiefs duke it out.
The +1: To add the McClellan Summation Index to your chart, select Price from the indicator dropdown menu, type $NYSI in the Parameters box, and select Area from the Style dropdown menu. To add the NYSE New Highs - New Lows, type $NYHL in the Parameters box, and to add Nasdaq New Highs - New Lows, type $NAHL.
But wait! There’s an easier way. Just click on the chart. This will bring up a live chart that you can save to any of your ChartLists by simply clicking the Save As button.
|