| Hey There Fellow ChartWatchers |
For years I've had folks tell me, "I know StockCharts has all the market data I want, but I have to hunt for it and jump from place to place!"
Well, my friends - hunt no more. As of today, we've solved that issue once and for all with the launch of our entirely new Market Summary page.
This all-in-one dashboard has been professionally curated with the key data and crucial indicators you need to truly understand current markets and their internals from the top down - including pre-built charts to match!
In one single resource, you can now track global equity indexes and compare country funds. You can see US stocks weighted by factors like growth, value, momentum, and quality. You can drill into breadth metrics like percentage of stocks above common moving averages or study sentiment, positioning, and exposure data among traders and investors. You can review sectors and industries to pinpoint the leaders and identify the laggards. And you can review other asset classes like Bonds, Commodities, Currencies, and Cryptos in detail.
Don't believe me? Here are a few key takeaways I've gleaned from one quick scroll through the new Market Summary:
• Buyers came for everything. Every global index, every US index, and all the country funds except China and Colombia closed higher this week. But it's still ugly. Other than the Dow Utilities, every US index is trading below its 20, 50, and 200-day moving averages.
• Large Cap Growth and Momentum were the two leading factors, up +8.06% and +9.11% this week.
• Breadth is still a bloodbath. Very low percentages of stocks in the major indexes trading above key moving averages (especially Small Caps!). Bullish percent indexes are deep in the red, and the number of stocks making new lows has spiked aggressively across the board. That said, those breadth metrics have ticked higher off their lows.
• Offensive sectors outpaced defensive sectors this week, but on the positioning and exposure chart it's clear that money is just not rotating to bullish assets. The Rydex Asset Ratio in particular keeps drifting defensive.
• Speaking of sectors, Technology and Industrials drew the most interest across the Cap Weight, Equal Weight, and Small Cap sector groups. In the Cap Weight group, those were actually the only two sectors that outperformed the S&P 500 itself.
• Gold continues to crush everything. GLD was the top performer on the Intermarket Analysis board, even beating a big week for stocks, and is up over +35% in the past year.
So let's get this thing in your hands! Click Here to access the new Market Summary page and explore all that this new resource has to offer. I also sat down to run through the page myself, so if you'd like to join me for a walkthrough before you grab the keys and take it for a spin, click the thumbnail below.

Oh, and one more thing ... THE CHARTS!
To take this new resource to the next level, we've also launched an accompanying ChartPack. In one click, you'll get 26 ChartLists — organized and pre-populated with charts for all of the indexes and datasets you see on the new Market Summary page — installed directly into your StockCharts account for free. No setup, no customization; just professionally designed charts collected into a structure you can use to analyze every corner of the market. Click Here to learn more and install the new ChartPack!
A friendly reminder: If you’re an OptionsPlay Add-on subscriber, be sure to join the members-only webinar on Tuesday, April 15, at noon EDT! |
| Keep Calm and Chart on, my friends. |
| Grayson Roze |
Chief Strategist, StockCharts.com
Author, Trading For Dummies
Author, Tensile Trading |
  |
|
|
| THIS WEEK'S ARTICLES |
| ChartWatchers |
| Investors on the Move: A Visual Guide to the Stock Market |
| by Jayanthi Gopalakrishnan |
| Another interesting week in the stock market comes to an end. The past few days were flooded with the twists and turns of President Trump's reciprocal tariffs, which were later put on a 90-day pause except for China, which got hit with higher tariffs... |
|
|
|
|
|
|
|
| Art's Charts |
| This Report Might Self Destruct in 5 Days |
| by Arthur Hill |
| In the opening scene of Mission Impossible 2, Ethan Hunt receives a message at the top of a sandstone butte. He puts on the glasses and listens to the message, which ends with the computer-generated phrase: "This message will self-destruct in five seconds... |
|
|
|
|
|
|
|
| A View From The Floor |
| Earnings From These 3 Stocks Could Be Key |
| by Jay Woods |
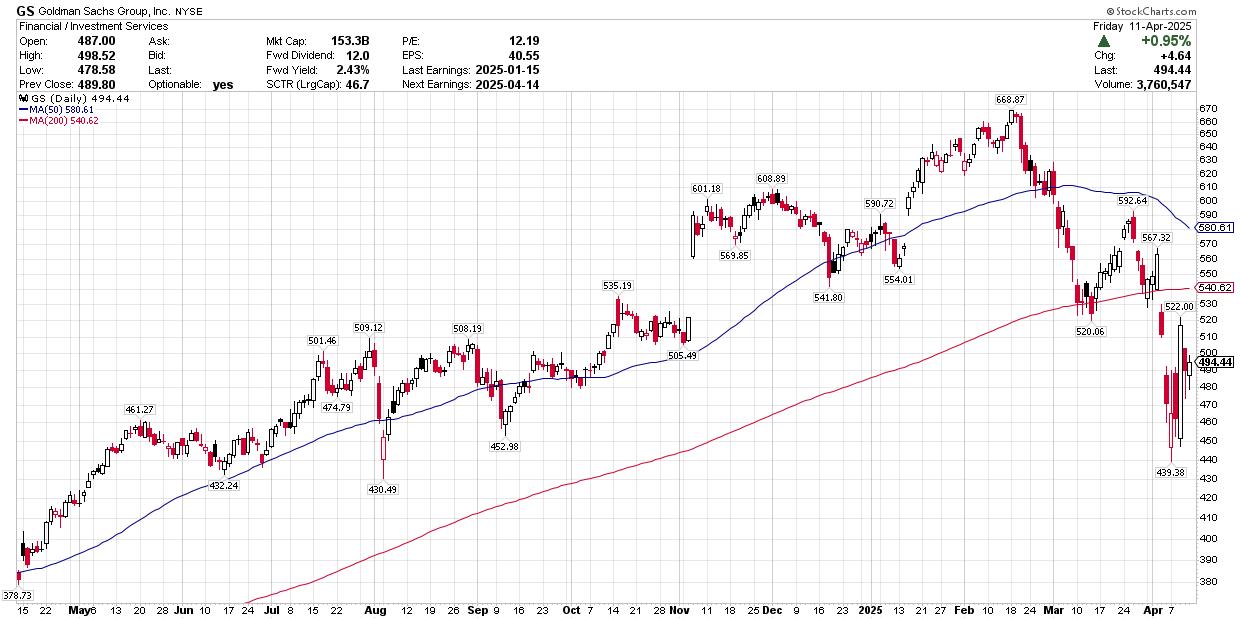
| This week, we're getting back to earnings season during the shortened four-day period. Goldman Sachs Group, Inc. (GS) reports on the heels of JP Morgan's solid results that saw its shares rally by 12.3% and recapture its 200-day moving average... |
|
|
|
|
|
|
|
|
|
|
|
| MORE ARTICLES → |
|