| Hello, Fellow ChartWatchers! |
Did someone just hit the reset button on market mayhem?
If you stepped away from the stock market after April 2 and just now peeked at this week’s chart of the S&P 500 ($SPX), you might wonder what all the fuss was about. The market resembles a boat drifting in calm waters — on the surface. Those who have been tuned to the market every day since April 2 know, however, there have been a lot of rough waters underneath.
As they say, “ignorance is bliss.”
From our Market Summary page, you can see that the S&P 500 notched a 5-day winning streak with a Bullish Percent Index of 74.40%. Investors are rotating back into offensive sectors such as Technology and Consumer Discretionary, and fear has subsided with the Cboe Volatility Index ($VIX) trading below 20. It’s beginning to look like the bulls are back in charge.
Here’s how things stand:
- Dow Industrials ($INDU): 42,654.74 (+0.78%)
- S&P 500 ($SPX): 5,958.38 (+0.70%)
- Nasdaq Composite ($COMPQ): 19,211.10 (+0.52%)
Before declaring victory, though, let’s not forget that the market loves drama. Are we out of the woods or just between narratives?
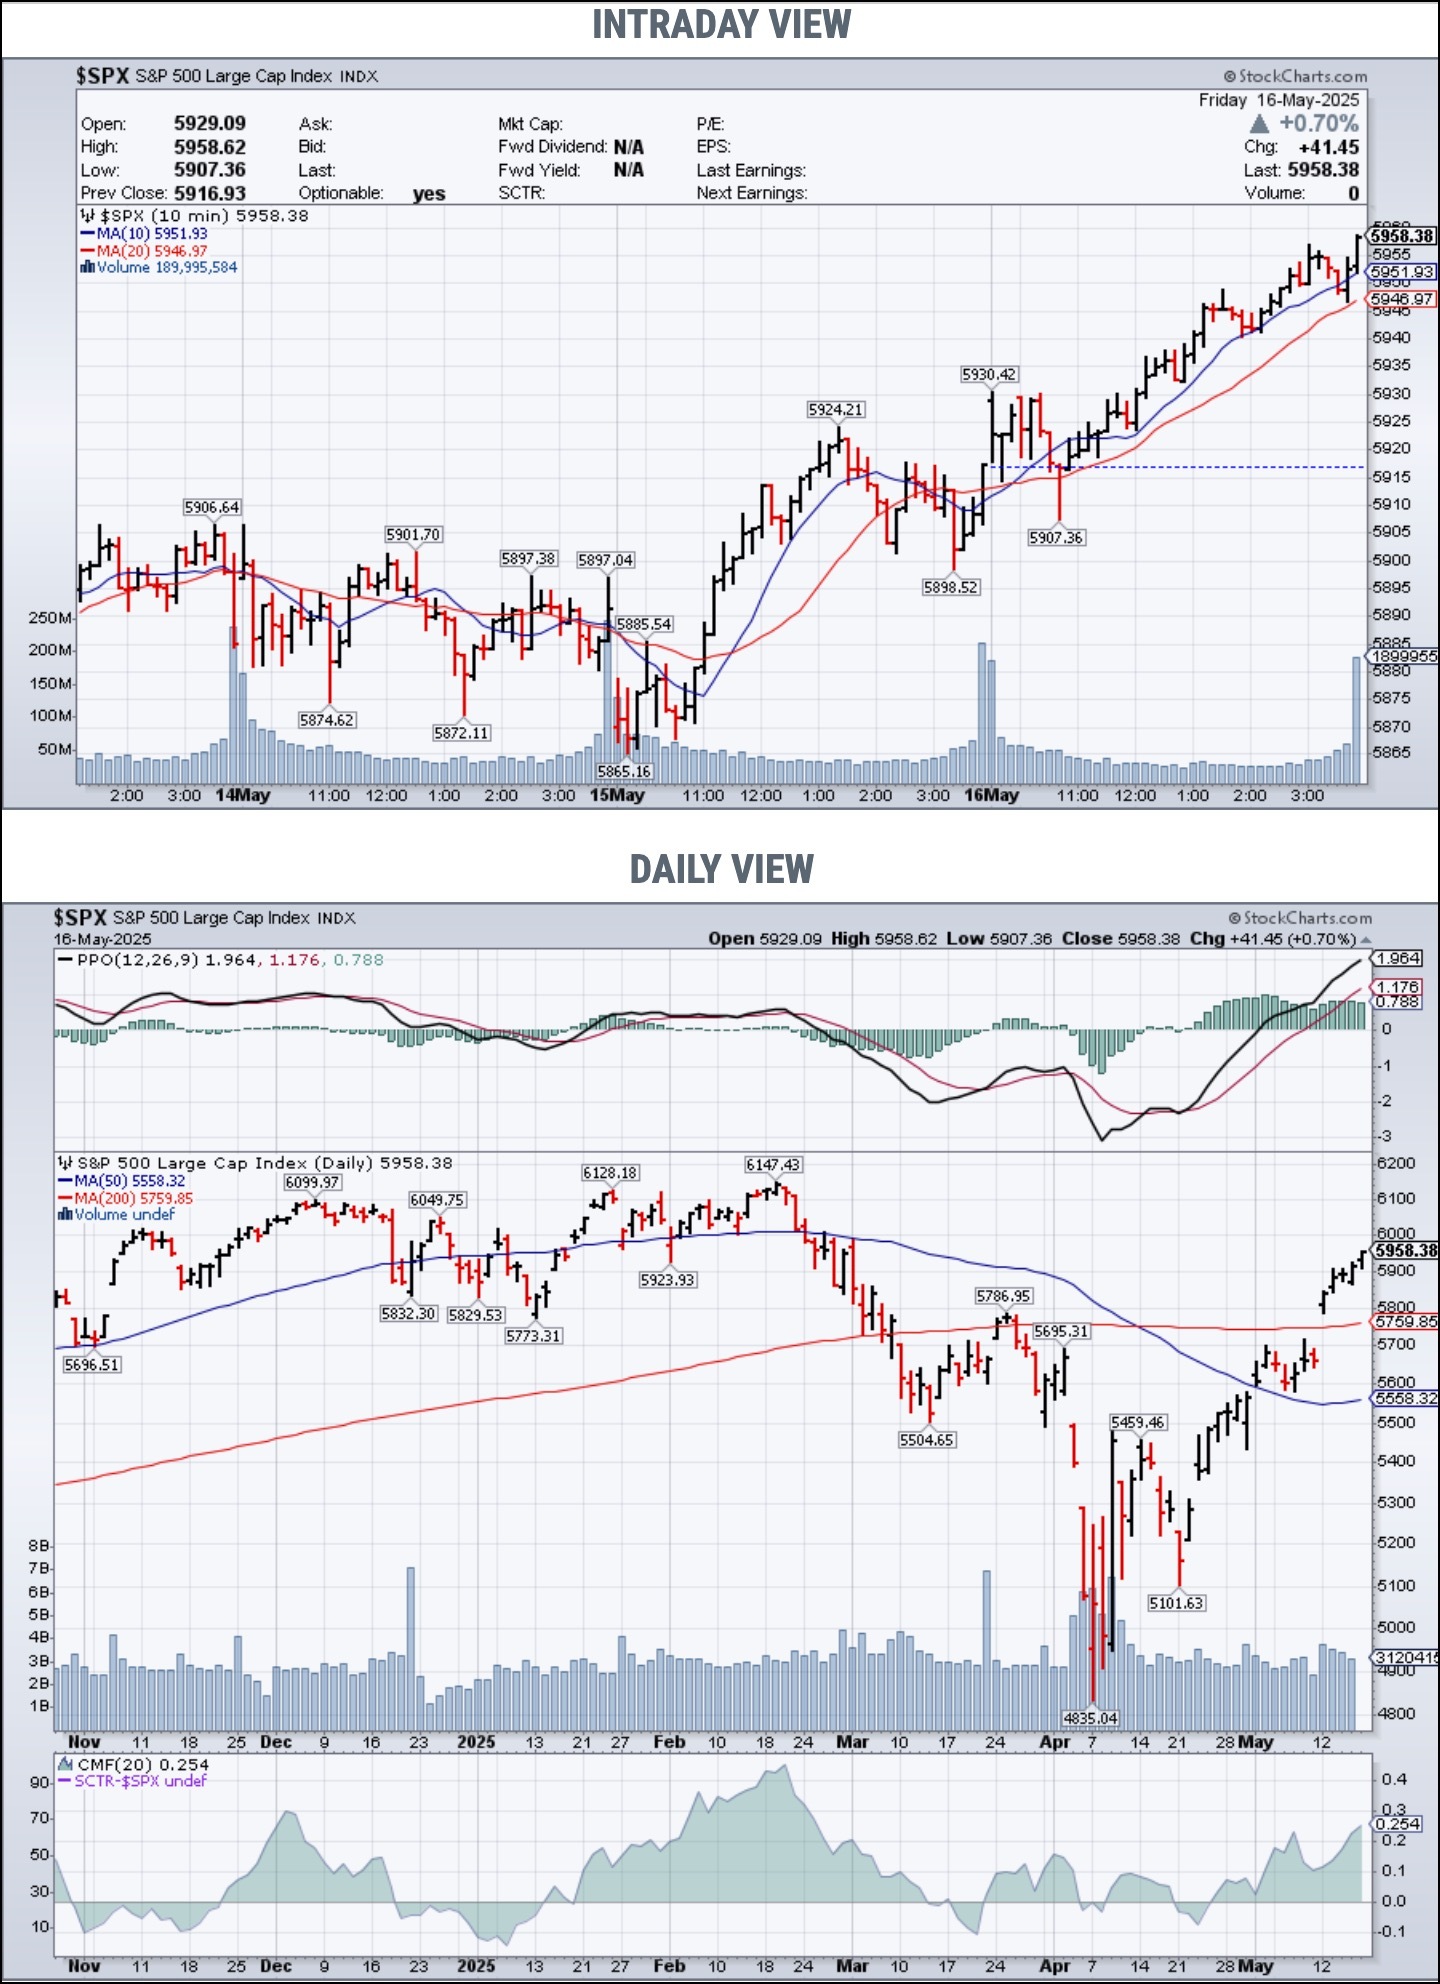
That’s where the GalleryView charts come in handy. Enter $SPX in the symbol box, and with a quick scroll, you can compare intraday, daily, and weekly price trends all in one place. If you’re watching $SPX (and you should be), make sure the trend direction confirms across all time frames.
The chart below displays the intraday and daily view of the S&P 500. Both confirm the uptrend, as does the weekly chart (not seen in the image). For a closer look, click the chart below to see the power of the GalleryView charts.
Here’s a bonus tip: Curious if stocks like NVIDIA Corp. (NVDA) are mirroring the S&P 500’s rebound? All you have to do is punch in “$SPX,NVDA” in the symbol box, and analyze them side by side. GalleryView simplifies your analysis (and also makes you look smarter!).
Note that you can customize the look of these charts by creating ChartStyles and saving them as GalleryDaily, GalleryWeekly, and GalleryIntraday.
So, what do you think? Do the multiple time frame S&P 500 charts say we’re back in bull territory? If so, you may want to bump up your equity exposure. Enjoy the calm — while it lasts.
If you’re interested in generating income consistently, regardless of which way the market is moving, consider attending the OptionsPlay webinar on May 20, noon EDT. Register using this link. |
| Have a great weekend! |
|
|
|
|
|