Art's Charts February 29, 2012 at 06:02 AM
With another strong close and leadership from large-cap tech stocks, SPY and QQQ extended their uptrends and there is no change in the overall picture. Stocks remain overbought and ripe for a corrective period, which could form as a pullback or a flat consolidation... Read More
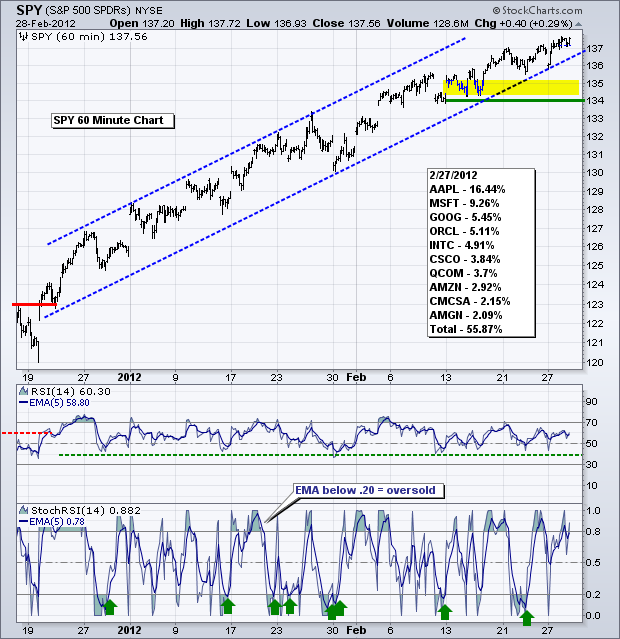
Art's Charts February 28, 2012 at 05:28 AM
The warning signs persist, but stocks remain in clear uptrends and selling pressure remains muted. First, recent strength in treasuries is a concern because they are negatively correlated with stocks... Read More
Art's Charts February 28, 2012 at 05:17 AM
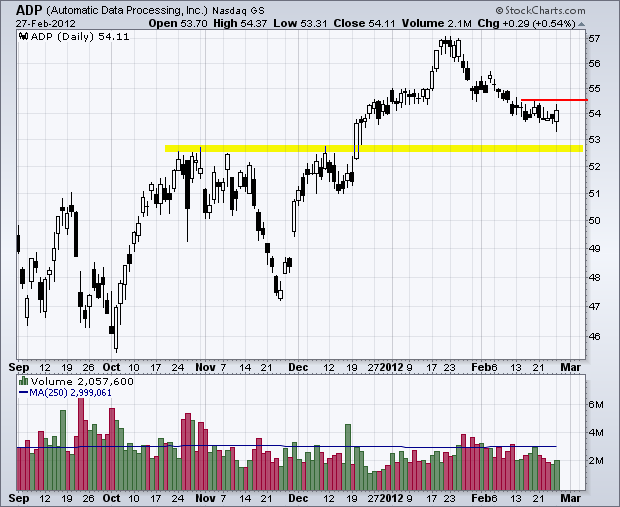
KR Confirms Harami with High Volume Surge. STT Challenges Triangle Trendline. TSN Firms at the 50% Retracement Line. Plus ADP and LLY. This commentary and charts-of-interest are designed to stimulate thinking... Read More
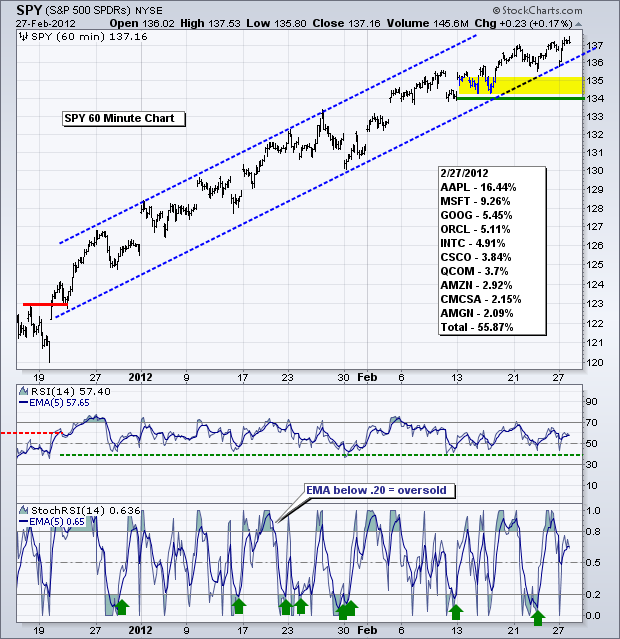
Art's Charts February 27, 2012 at 04:30 AM
It was a rather strange week on the intermarket front. Stocks and oil moved higher, which is normal. However, treasuries also moved higher, which is not normal. Strength in stocks and oil should be offset by weakness in treasuries... Read More
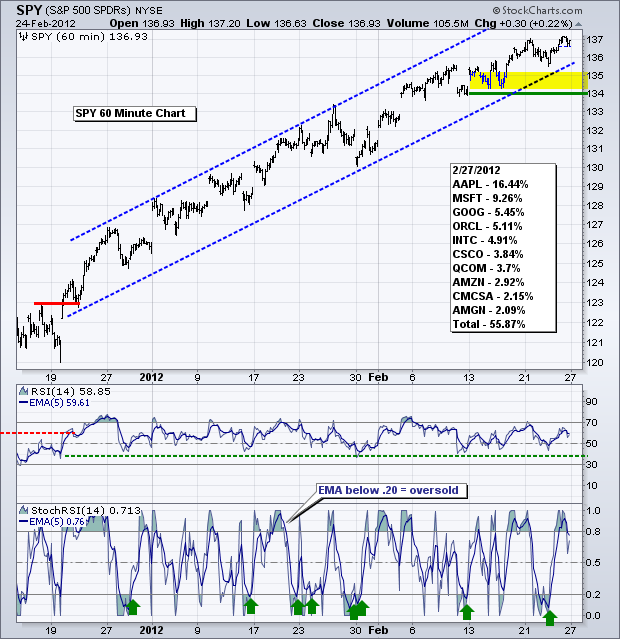
Art's Charts February 24, 2012 at 04:48 AM
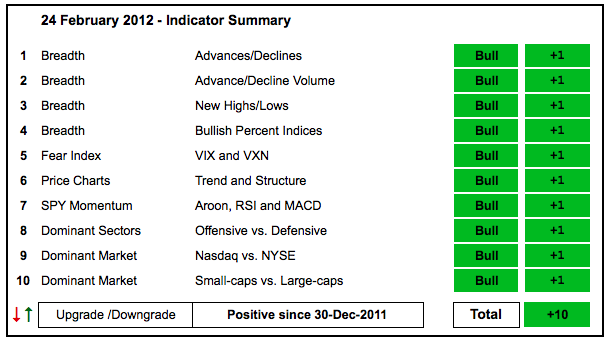
Unsurprisingly, there is no change in the indicator summary as stocks held their gains this week. Trading turned a little more indecisive, but we have yet to see any signs of significant selling pressure... Read More
Art's Charts February 24, 2012 at 03:54 AM
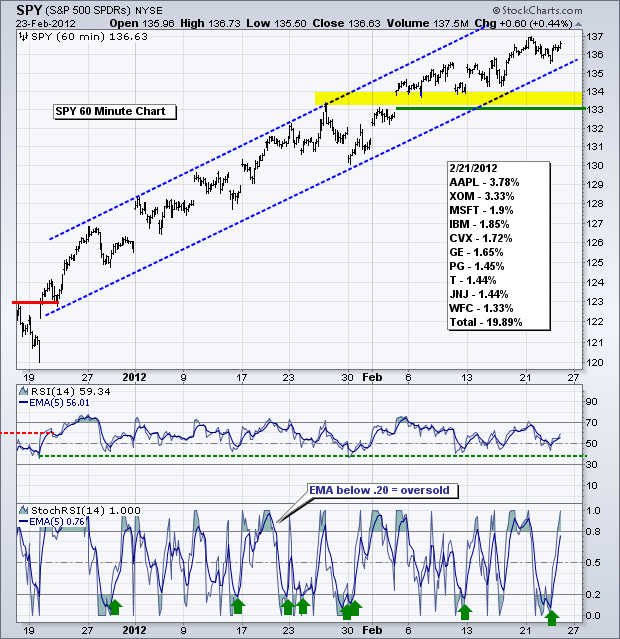
There are no major changes on the charts. However, yesterday was a bit strange because both treasuries and stocks moved higher. The 7-10 year T-Bond ETF (IEF) was up .14% and the S&P 500 ETF (SPY) was up .44%... Read More
Art's Charts February 23, 2012 at 05:51 AM
Stocks edged lower on Wednesday as commodities moved higher. There is generally a positive correlation between stocks and commodities, including gold. The Dollar and commodities are generally negatively correlated, as are stocks and treasures... Read More
Art's Charts February 23, 2012 at 05:33 AM
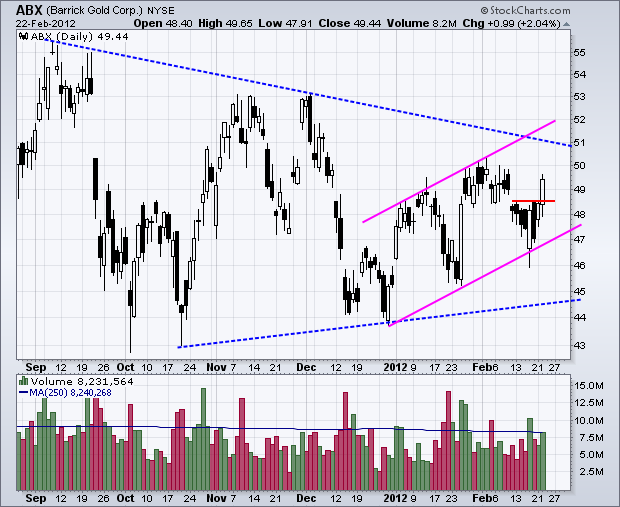
Bollinger Bands Narrow for BA as Ascending Triangle Forms. GFI Firms at Key Retracement. GOOG Forms Harami at Resistance. Plus ABX and ORCL. This commentary and charts-of-interest are designed to stimulate thinking... Read More
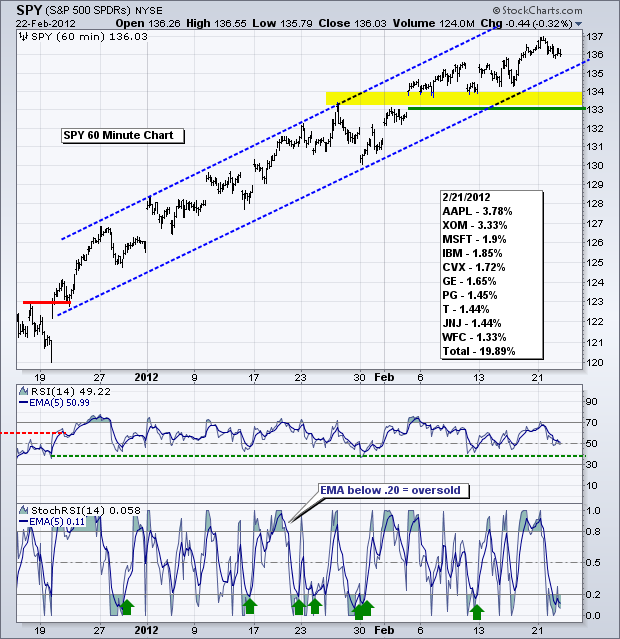
Art's Charts February 22, 2012 at 05:50 AM
Even though the major index ETFs remain in uptrends, signs of weakness are emerging under the hood and stocks are ripe for a corrective period. First, small-caps continue to show relative weakness since 3-Feb, which is when IWM peaked... Read More
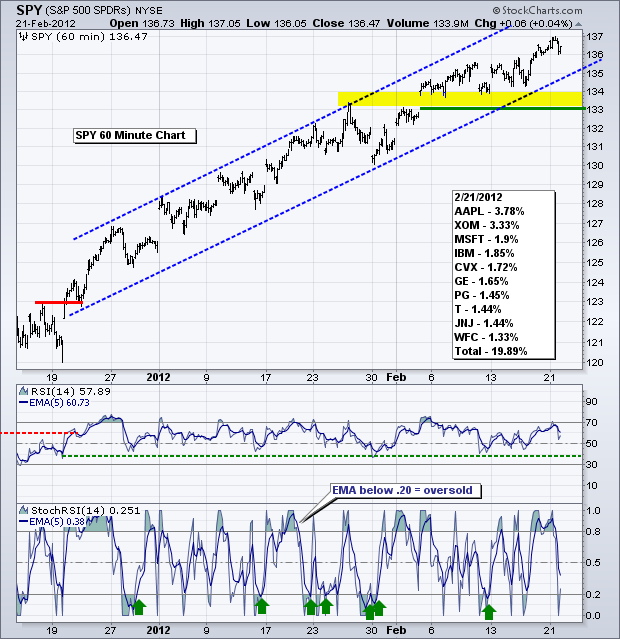
Art's Charts February 21, 2012 at 04:19 AM
Stocks have been overbought for weeks, but the uptrend just keeps extending. SPY is a classic example of an index ETF becoming overbought and remaining overbought. The ETF broke resistance on 19-Dec to start the current uptrend, which is some nine weeks old... Read More
Art's Charts February 21, 2012 at 04:14 AM
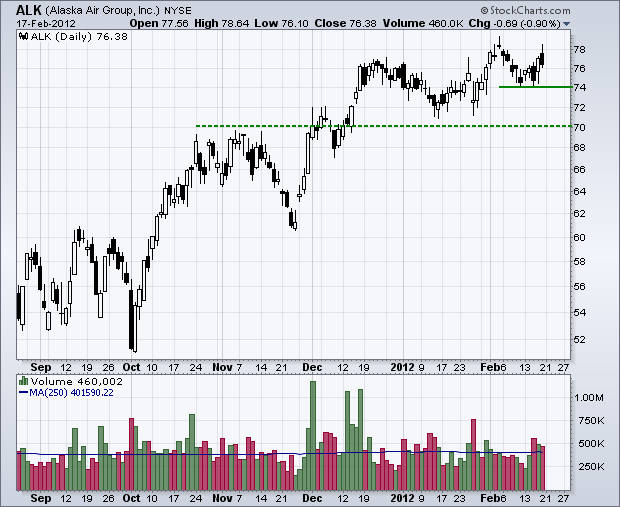
ATVI Edges Higher within Rising Wedge. IPI Consolidates after Breakout. LLY Gaps above Falling Wedge Trendline. Plus ALK, BSX, CTSH, IPI, OMX This commentary and charts-of-interest are designed to stimulate thinking... Read More
Art's Charts February 17, 2012 at 05:39 AM
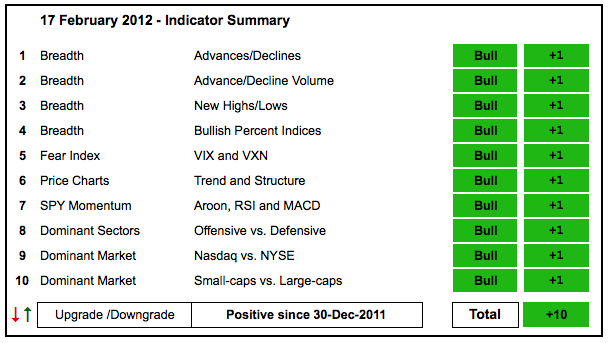
There is no change in the indicator summary as stocks maintain their gains and show no signs of significant selling pressure. While this rally is certainly getting overextended, it takes actual selling pressure to produce a pullback... Read More
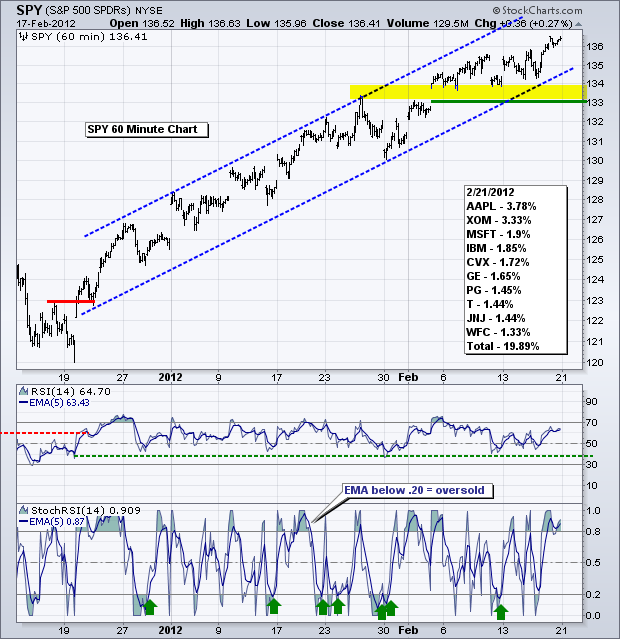
Art's Charts February 17, 2012 at 04:34 AM
Stocks may seem overbought, sentiment may seem too bullish and the odds of a correction may seem high, but a pullback cannot materialize until there is a noticeable and sustainable increase in selling pressure... Read More
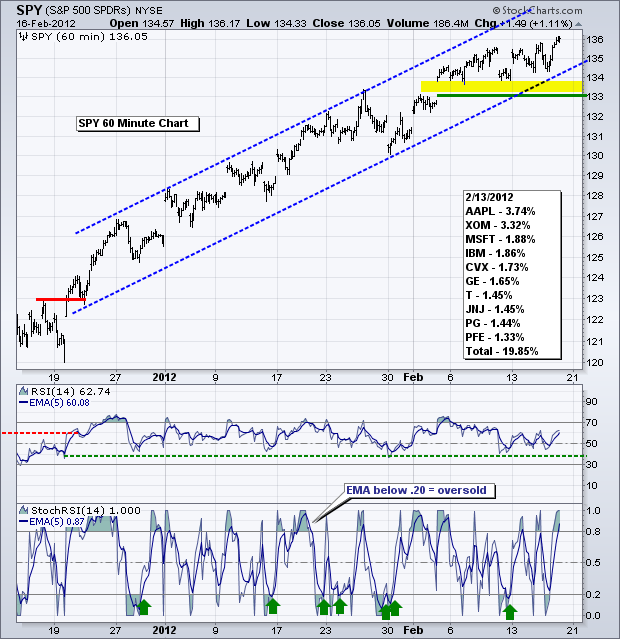
Art's Charts February 16, 2012 at 05:35 AM
The Dollar broke resistance, the Euro moved lower and stocks gave up early gains with a rather sharp afternoon sell-off. Conditions remain ripe for a corrective period and stocks are showing signs of fatigue... Read More
Art's Charts February 16, 2012 at 05:29 AM
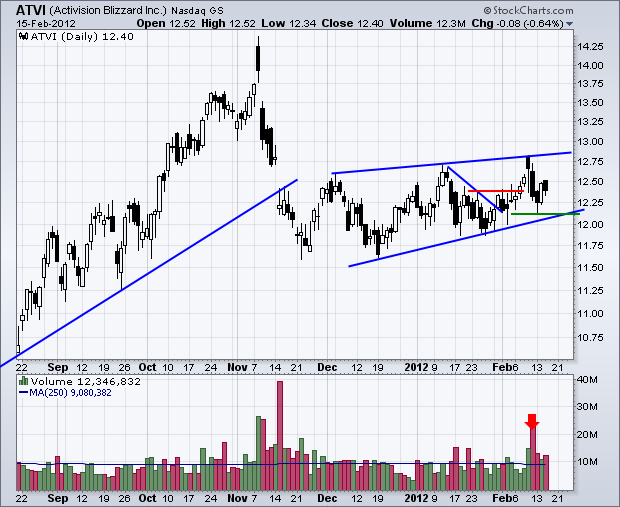
BBY Hits Resistance at Key Retracement. MMM Stalls as Bollinger Bands Contract. VZ Forms Triangle within Downtrend. Plus ATVI, PNRA, TGT This commentary and charts-of-interest are designed to stimulate thinking... Read More
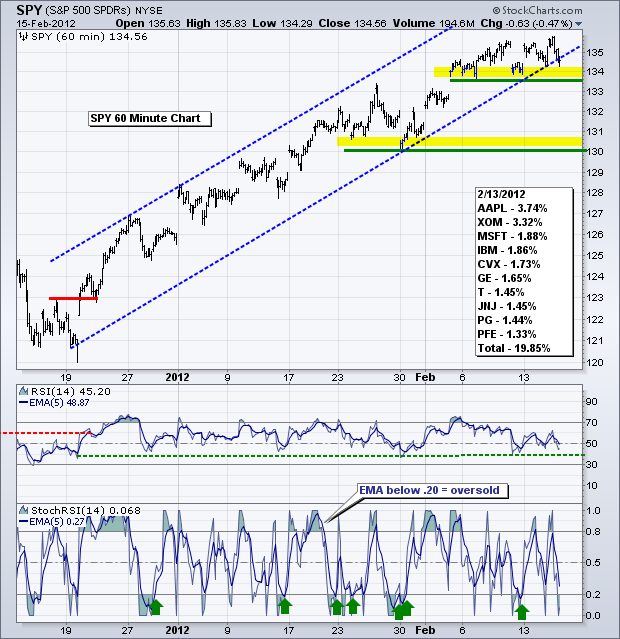
Art's Charts February 15, 2012 at 04:12 AM
Stocks edged lower most of the day and then surged in the final 30 minutes. Even the smallest of dips brought out the bulls. I would hazard a guess that a fair amount of money missed this rally and some of it is on the sidelines waiting for a pullback... Read More
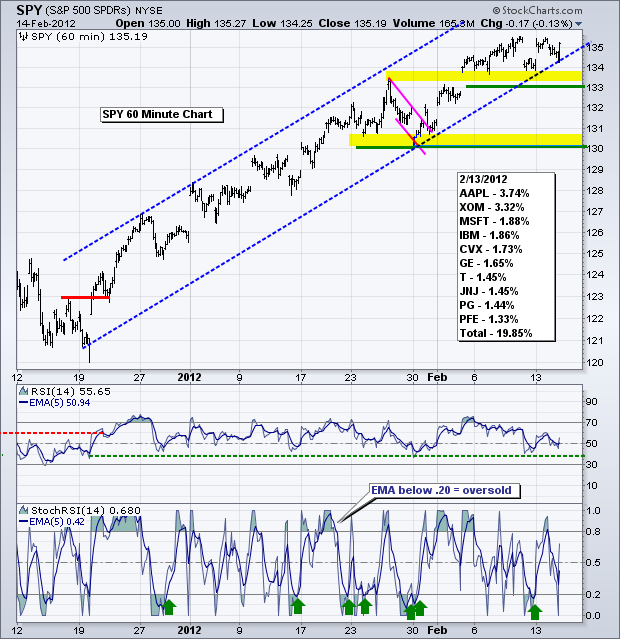
Art's Charts February 14, 2012 at 05:28 AM
Is it turnaround Tuesday? Stocks are in uptrends, but way overbought and ripe for a corrective period. Small-caps (IWM) are lagging large-caps (SPY) the last 6-7 days and this is a sign of market fatigue... Read More
Art's Charts February 14, 2012 at 05:23 AM
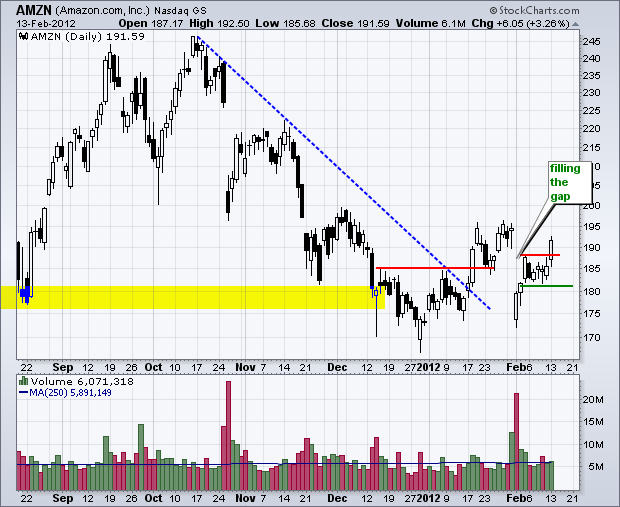
AMZN Fills the Gap. NIHD Forms Tight Consolidation after Breakout. SFD Shows Relative Weakness with Falling SCTR. Plus FRX,MCK,PLCE,SNDK,WAG This commentary and charts-of-interest are designed to stimulate thinking... Read More
Art's Charts February 13, 2012 at 05:12 AM
Asian and European markets are in a risk-on mood after the Greek parliament passed the austerity package. This mood is extending to US stock futures, which are up modestly in pre-market trading. Gold, oil and the Euro are high, while the Dollar and treasuries are lower... Read More
Art's Charts February 10, 2012 at 04:44 AM
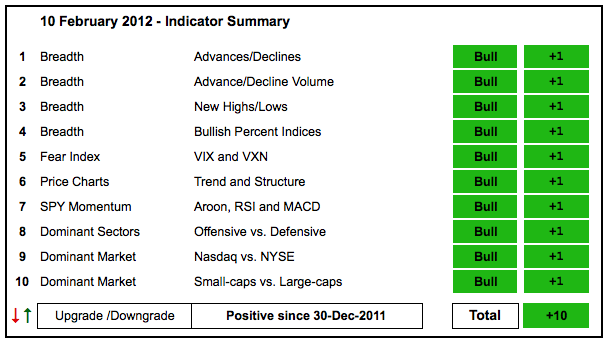
With further strength this week, it is little surprise that the indicator summary remains unchanged at +10. Even though there are no signs of weakness, there are plenty of overbought signs. Eight of the nine sector Bullish Percent Indices are above 80%... Read More
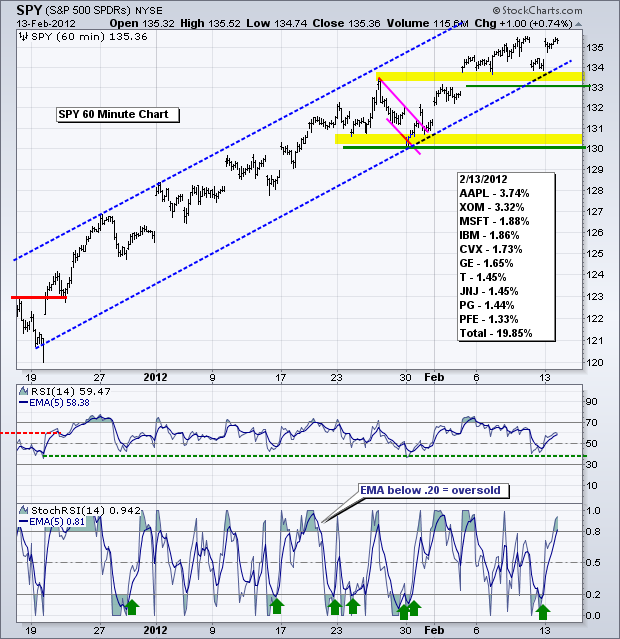
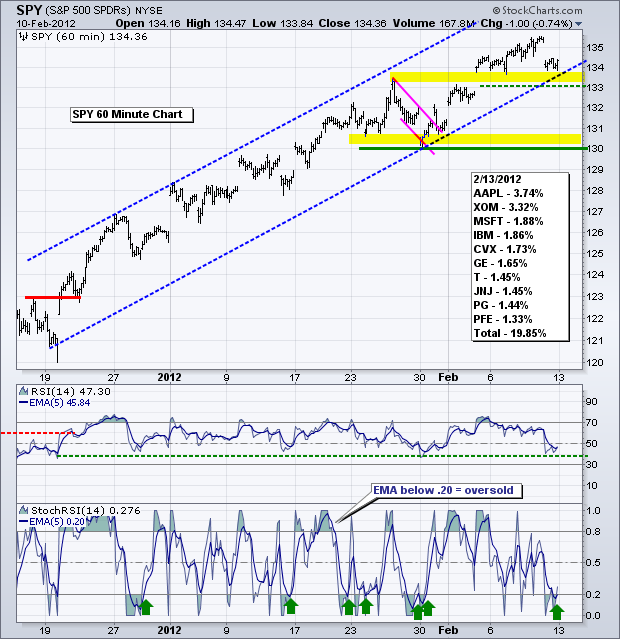
Art's Charts February 10, 2012 at 03:41 AM
While the medium-term and long-term outlooks remain bullish, stocks are in a rather precarious short-term situation. The major index ETFs are overbought, sentiment is excessively bullish and Greek lawmakers have yet to pass the austerity measures required to receive EU aid... Read More
Art's Charts February 09, 2012 at 04:20 AM
The bulls are piling on. While we can never be sure when exactly it happened, note that Nouriel Roubini, aka Dr. Doom, recently turned bullish. In fact, his director of equity and allocation strategy, Gina Sanchez, suggested that the current rally could extend for months... Read More
Art's Charts February 09, 2012 at 04:12 AM
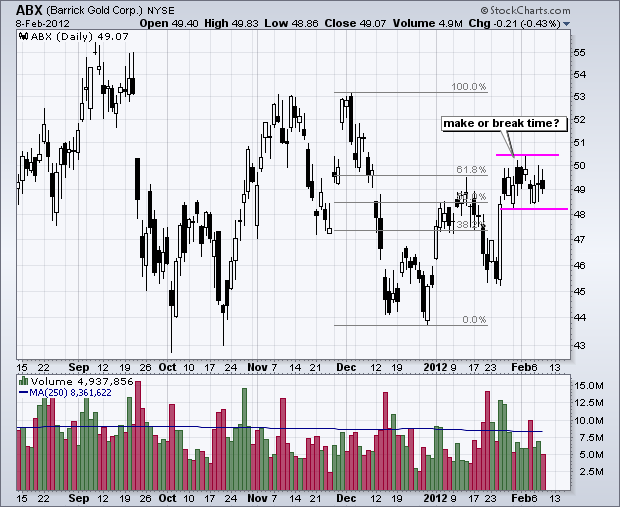
CPN Surges above Resistance with Big Volume. GFI Forms Pennant Consolidation. WLL Breaks Ascending Triangle Resistance. Plus ABX, GG, YHOO This commentary and charts-of-interest are designed to stimulate thinking... Read More
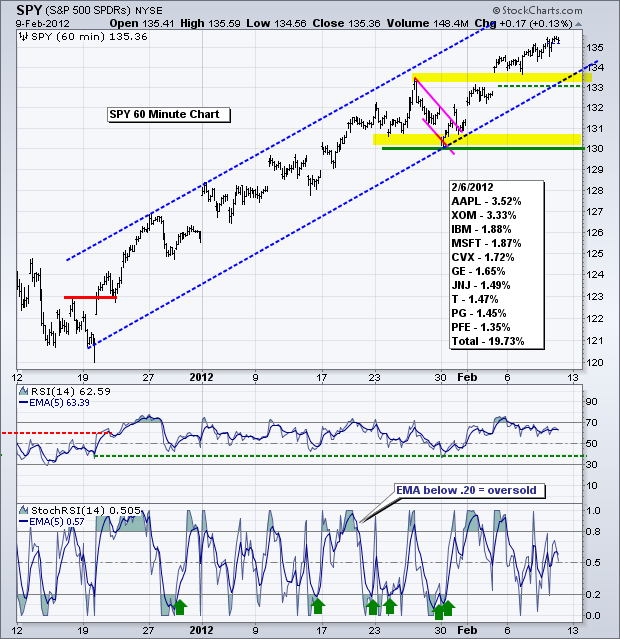
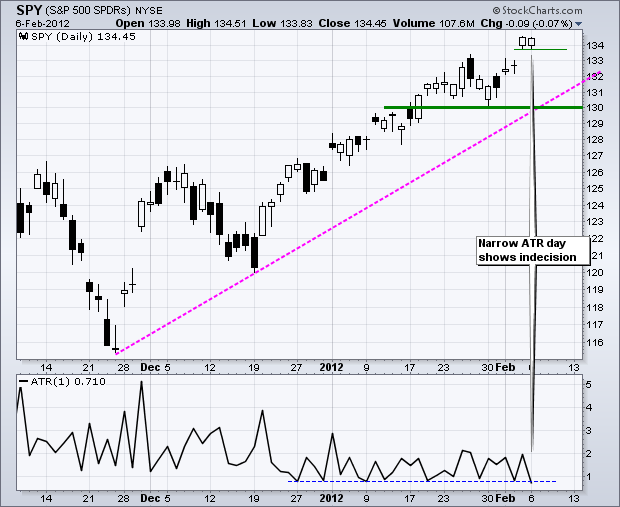
Art's Charts February 08, 2012 at 04:26 AM
After a narrow day for Average True Range (ATR) indicator on Monday, stocks started the day weak on Tuesday, but quickly recovered and moved into positive territory... Read More
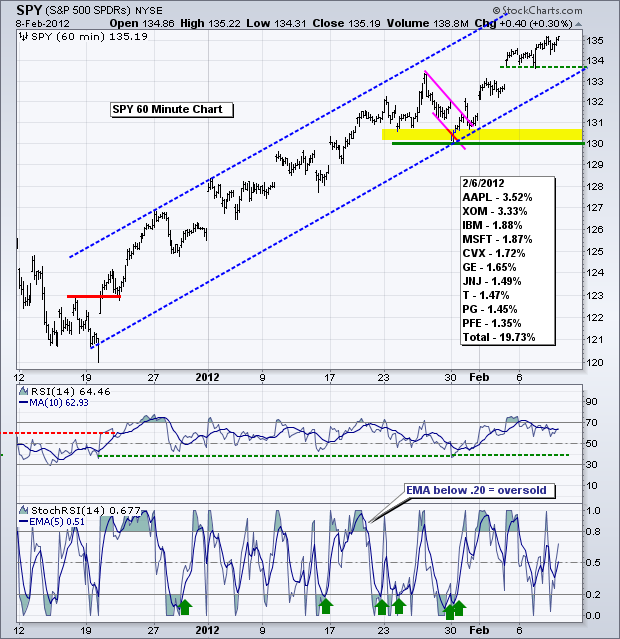
Art's Charts February 07, 2012 at 04:43 AM
Today could be volatile. First, stocks are overbought after a seven week advance. Second, Bernanke testifies before Congress today. Third, Greek debt negotiations continue and Greek unions put out the call for a general strike on Tuesday... Read More
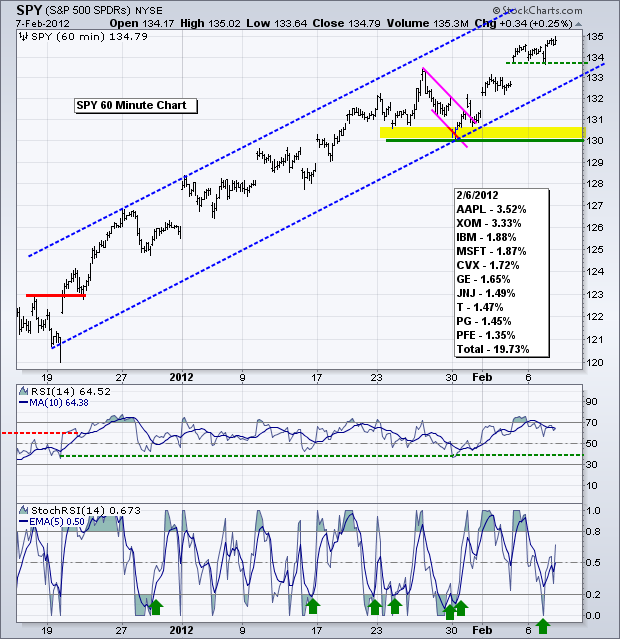
Art's Charts February 07, 2012 at 04:39 AM
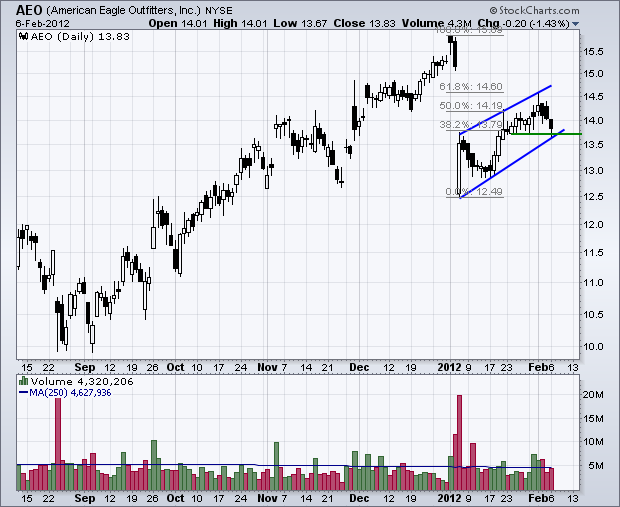
$AEO Retraces 61.80% with Rising Wedge. $DVN Forms Large Triangle Consolidation. Plus $ADP, $PLCE, $WCRX This commentary and charts-of-interest are designed to stimulate thinking... Read More
Art's Charts February 06, 2012 at 05:12 AM
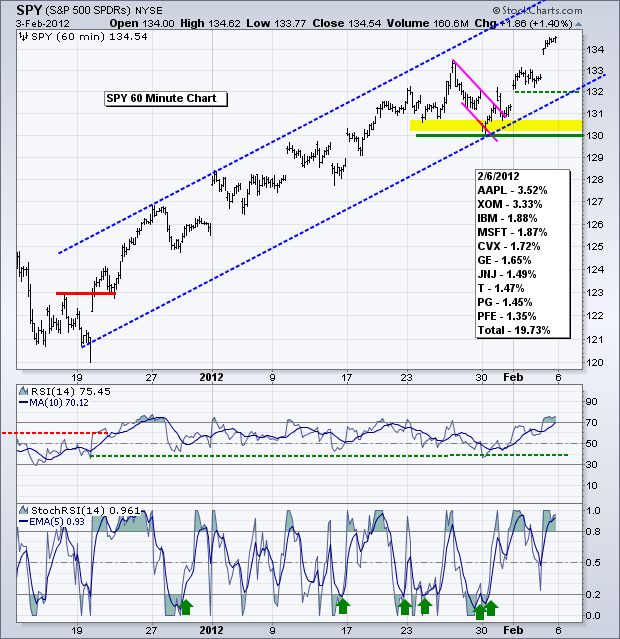
Stocks extended their short-term uptrends with strong moves on Friday. SPY, QQQ and IWM all hit new highs for the move and the short-term uptrends are now entering their eighth week. These moves started with a gap and breakout on December 19th... Read More
Art's Charts February 03, 2012 at 06:58 AM
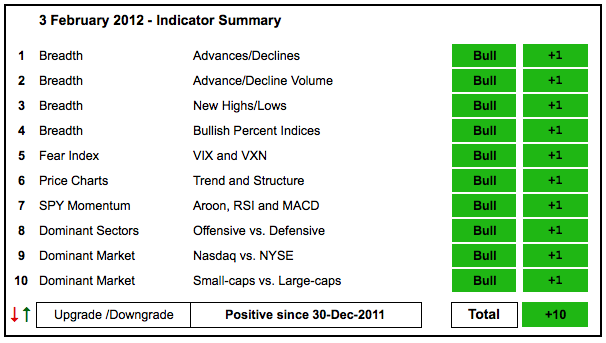
There is no change in the indicator summary as all ten indicator groups remain in bull mode. The NYSE AD Line surged to yet another 52-week high and the Nasdaq AD Volume Line moved sharply higher the last six weeks... Read More
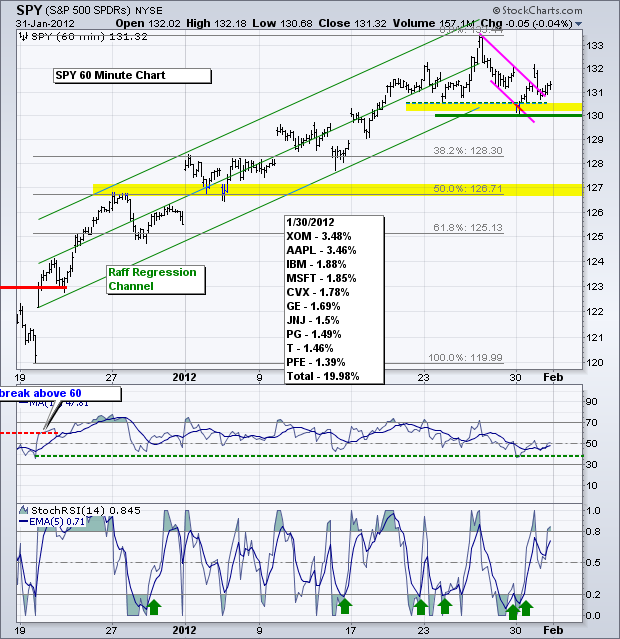
Art's Charts February 03, 2012 at 05:29 AM
And now for the Employment Report....and Factory Orders....and ISM Services. This is like the golden trio of economic reports. In one day we will cover employment, manufacturing and services. Stocks are overbought... Read More
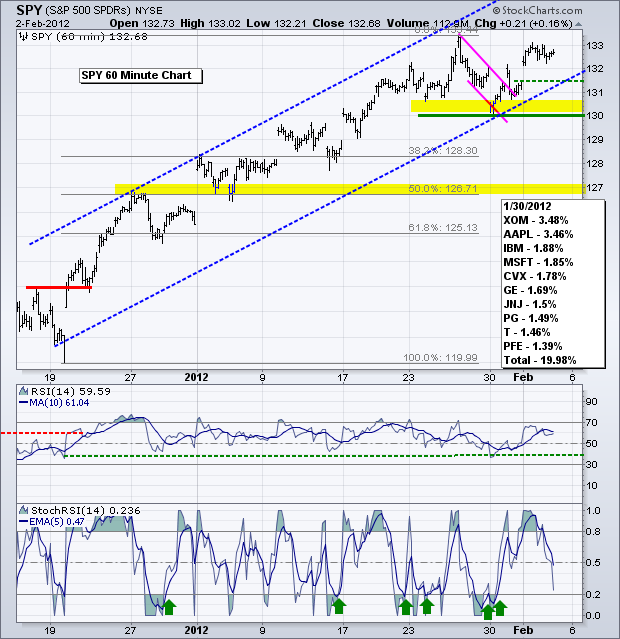
Art's Charts February 02, 2012 at 04:07 AM
The first trading day of the month produced a relatively modest gain in the S&P 500 ETF, but big gains in the Russell 2000 ETF and S&P MidCap 400 SPDR. Stocks gapped up on the open and then consolidated above their gaps... Read More
Art's Charts February 02, 2012 at 04:03 AM
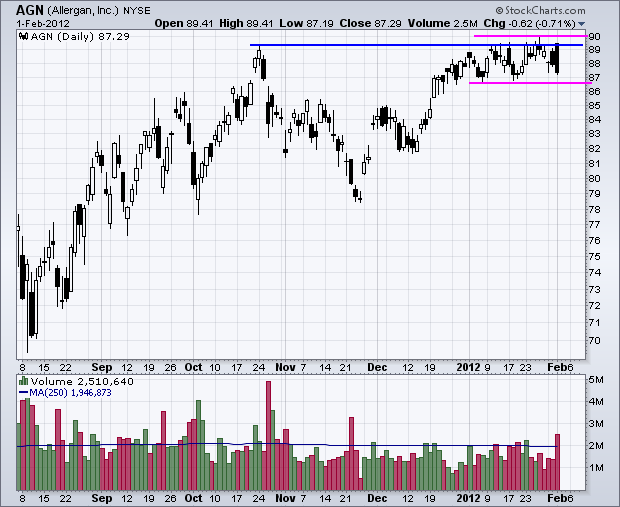
Careful out there. It is still earnings season. AGN Forms Outside Reversal at Resistance. CHH Forms Bearish Wedge and Bearish Engulfing. IMN Traces out Ascending Triangle. Plus AMX and CVN This commentary and charts-of-interest are designed to stimulate thinking... Read More
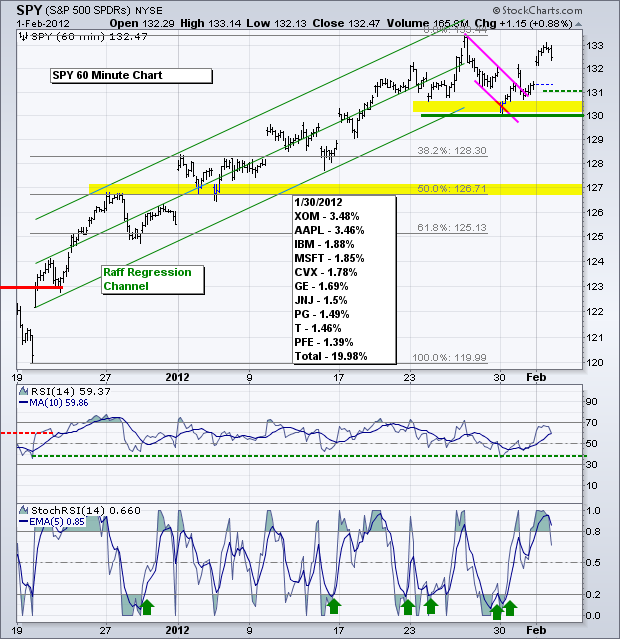
Art's Charts February 01, 2012 at 04:09 AM
The intermarket arena shows a shift from risk-on to risk-off over the last six to seven days. The 20+ Year T-Bond ETF (TLT) and the Gold SPDR (GLD) are up over 4%, while the US Oil Fund (USO) and the S&P 500 ETF (SPY) are down slightly... Read More