Art's Charts March 29, 2012 at 05:13 AM
Programming Note: I will be on family vacation the next two weeks and Art's Charts will return on Monday, April 16th. Chinese stocks are under pressure again this morning, but US stock futures are holding fairly firm – so far... Read More
Art's Charts March 29, 2012 at 05:10 AM
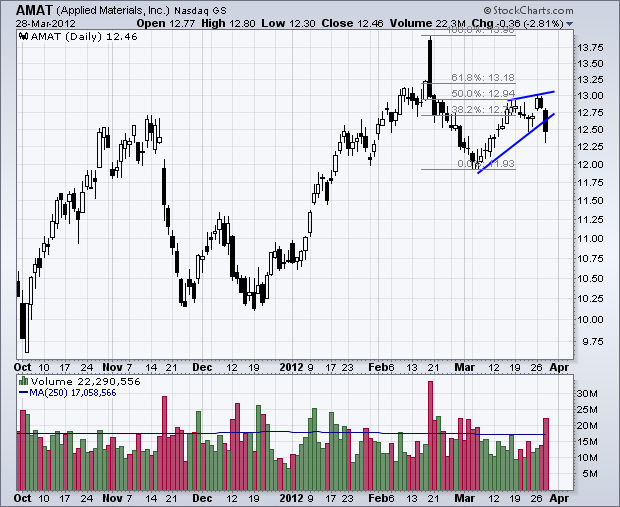
AMAT Breaks Wedge Support with big Volume. BA Remains Stuck in Long Consolidation. DE Declines from Resistance. Plus CAKE and MCHP This commentary and charts-of-interest are designed to stimulate thinking... Read More
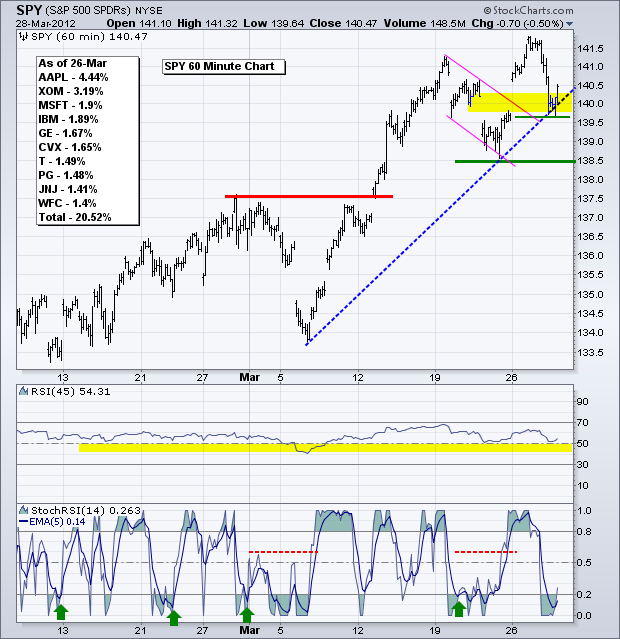
Art's Charts March 28, 2012 at 04:20 AM
Chinese stocks got slammed on Wednesday and pervasive weakness could weigh on US stocks. The major index ETFs remain in uptrends, but are overbought after big moves on Monday and still quite vulnerable to both a short-term and medium-term correction... Read More
Art's Charts March 28, 2012 at 02:47 AM
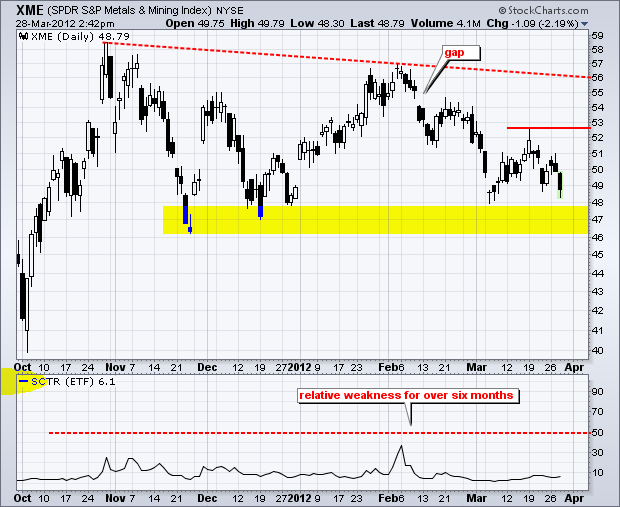
The Metals & Mining SPDR (XME) continues to show relative weakness as it tests its support zone stemming from the November-December lows. Also notice that the StockCharts Technical Rank (SCTR) confirms relative weakness by holding below 50 for over six months... Read More
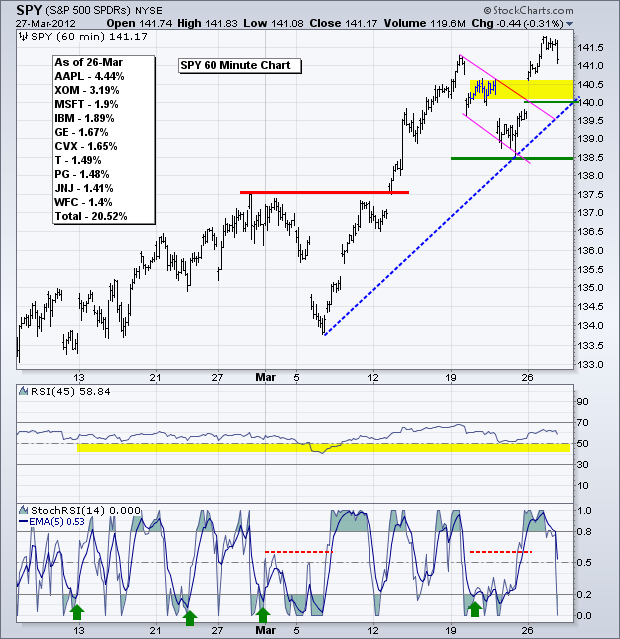
Art's Charts March 27, 2012 at 05:01 AM
Stocks moved sharply higher on Monday with small-caps leading the charge. Sector-wise, the technology, consumer discretionary, finance, industrials and healthcare sectors gained over 1.5% to show upside leadership... Read More
Art's Charts March 27, 2012 at 04:49 AM
AMX Surges above Resistance with Good Volume. LUV Bounces off Support with High Volume. MON Consolidates with Tight Triangle. Plus ALK, FCX, MCP, XRX This commentary and charts-of-interest are designed to stimulate thinking... Read More
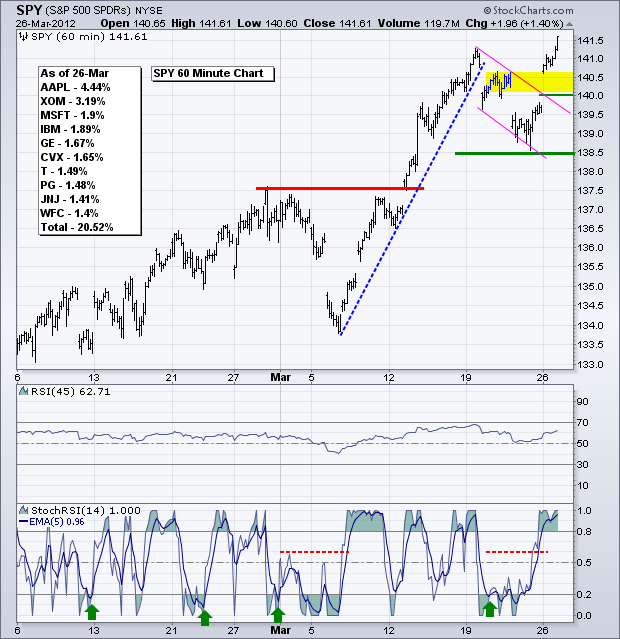
Art's Charts March 26, 2012 at 04:30 AM
Stocks got an oversold bounce with small-caps, materials and energy leading the way on Friday. Despite this bounce, these three are lagging the broader market overall, which means this is a case of the worst hit groups getting the best bounce... Read More
Art's Charts March 23, 2012 at 07:54 AM
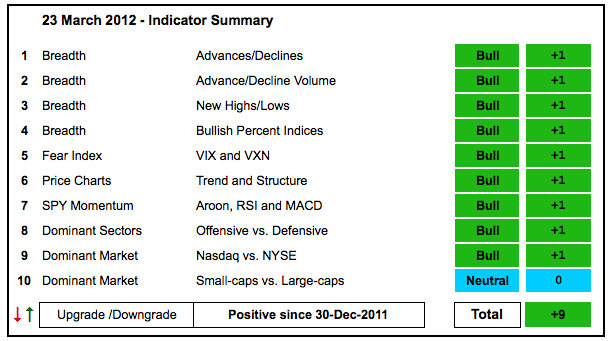
The indicator summary remains firmly positive with relative weakness in small-caps the only concern in the market right now. Well, I am also concerned with overbought conditions that could lead to a corrective period ahead... Read More
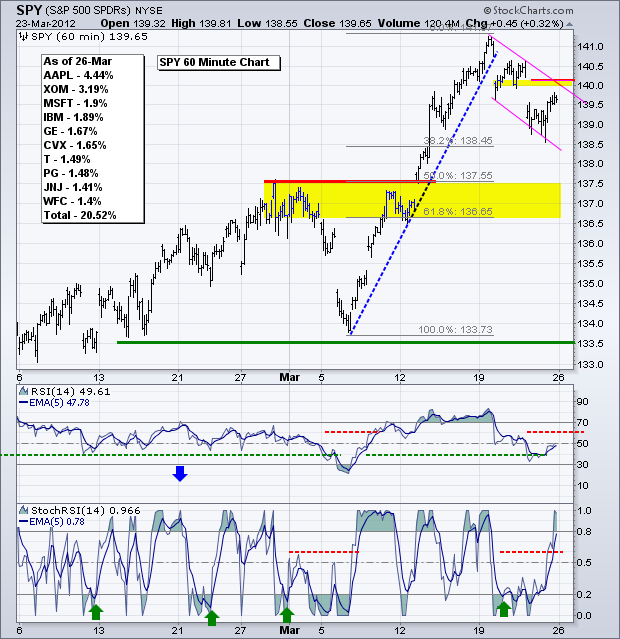
Art's Charts March 23, 2012 at 04:32 AM
The second shoe dropped for the S&P 500 ETF (SPY) and Russell 2000 ETF (IWM), but the Nasdaq 100 ETF (QQQ) held up rather well (surprise, surprise). I heard an interview with Barry Ritholtz talking about the four asset classes: stocks, commodities, bonds and Apple... Read More
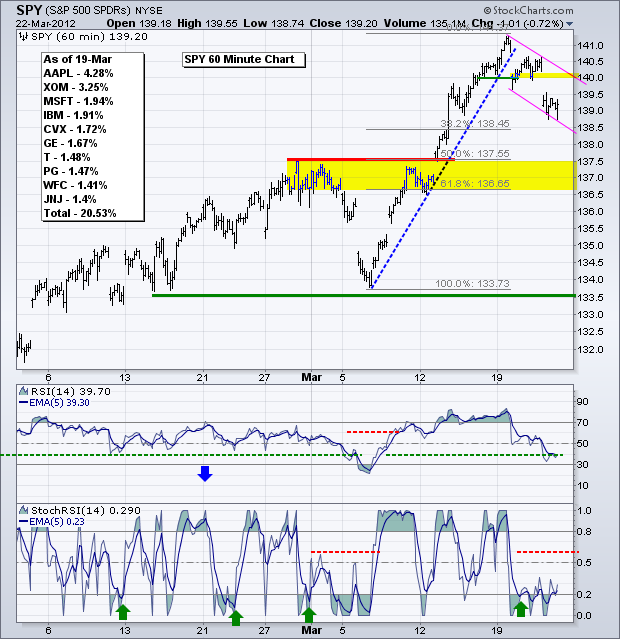
Art's Charts March 22, 2012 at 06:09 AM
Is the second shoe about to drop? Stocks fell sharply on the open Tuesday and then consolidated since this open. Short-term, and I do mean very short-term, the S&P 500 ETF (SPY) held the gap down and formed a pennant consolidation on the 60-minute chart... Read More
Art's Charts March 22, 2012 at 06:02 AM
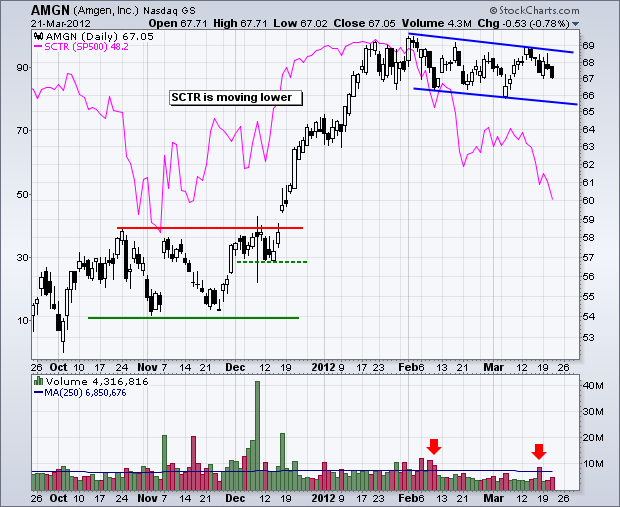
CAT Gaps Down on High Volume. KSS Stalls after Gap Down. MON Forms Triangle Consolidation. Plus AMGN, HAL, OIH, SWC This commentary and charts-of-interest are designed to stimulate thinking... Read More
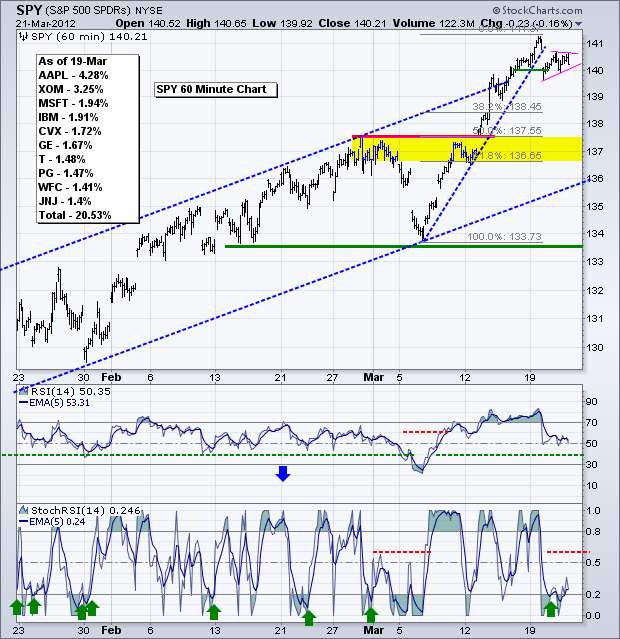
Art's Charts March 21, 2012 at 06:47 AM
Stocks were hit with selling pressure on the open, but the major index ETFs worked their way higher the rest of the day. The S&P 500 ETF (SPY) opened around 140 and worked its way to the 140.60 area by the afternoon... Read More
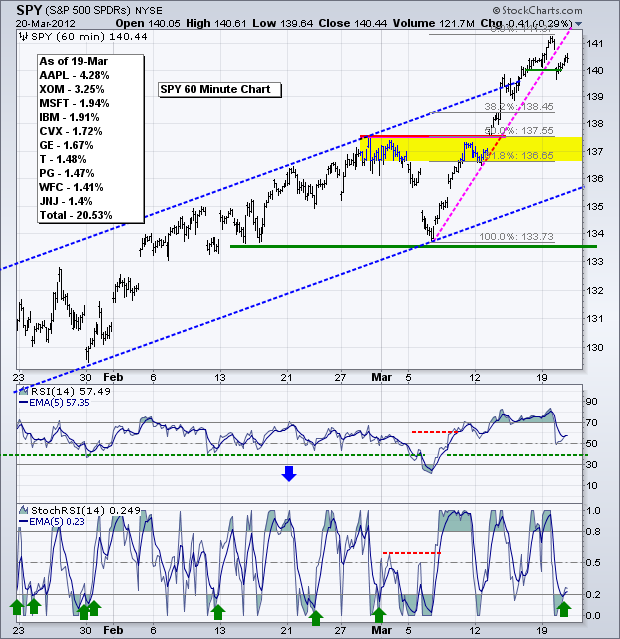
Art's Charts March 20, 2012 at 07:18 AM
The song remains the same (circa 1973). Stocks are overbought, but there are simply no signs of significant selling pressure. Maybe that will change with stock futures down in early trading on turnaround Tuesday. Over the last nine days, the S&P 500 ETF (SPY) is up 4... Read More
Art's Charts March 20, 2012 at 07:13 AM
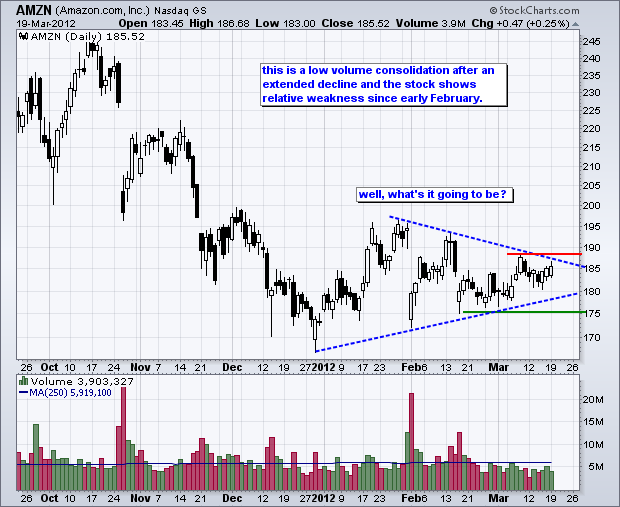
AMZN Underperforms with Triangle Consolidation. CHH Stalls Below Late December high. RDC Forms Harami Cross within Rising Wedge. Plus BIDU, CHH, CHRW, D, QLGC and WIN This commentary and charts-of-interest are designed to stimulate thinking... Read More
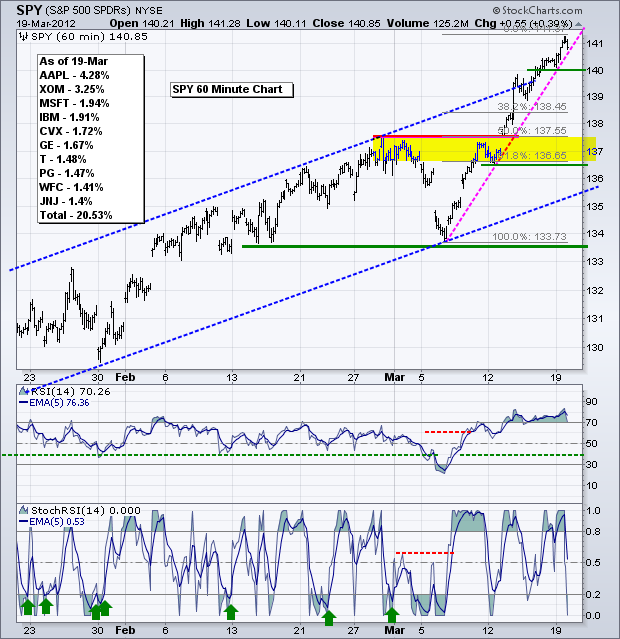
Art's Charts March 19, 2012 at 05:27 AM
Stocks are about as overbought as they have been in a long time. Even so, there are simply no signs of significant or sustained selling pressure. Declines, such as those seen in late January or early March, have been short affairs lasting just a few days... Read More
Art's Charts March 16, 2012 at 06:26 AM
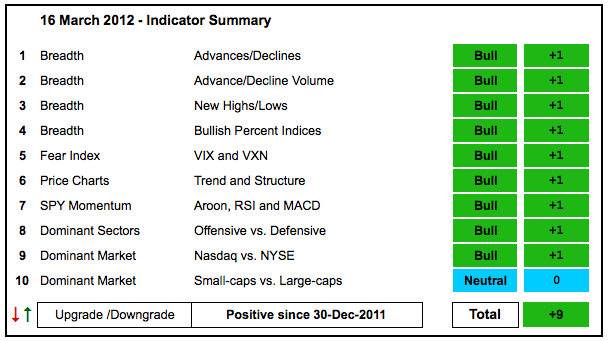
There is no change in the indicator summary. Nine indicators were bullish at the start of the week and nine remain bullish. The AD Volume Lines surged to new highs with a strong move the last seven days... Read More
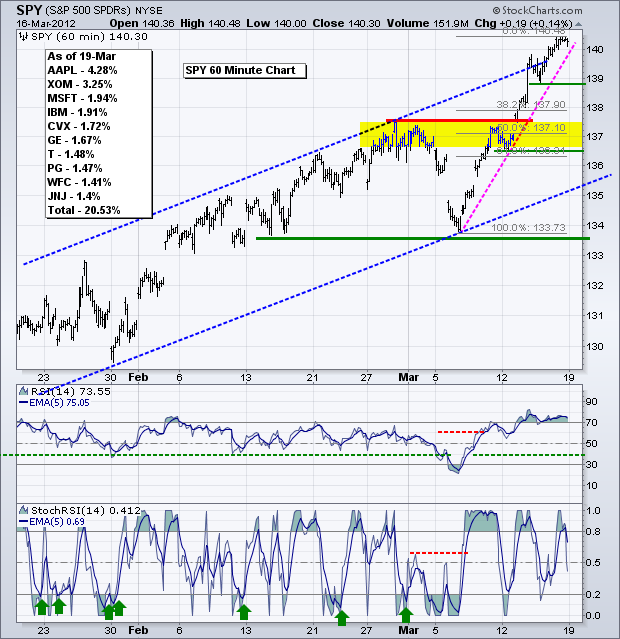
Art's Charts March 16, 2012 at 05:04 AM
There is not much change overall. Stocks remain in strong uptrends with no signs of selling pressure. The S&P 500 ETF (SPY) surged above the upper trendline of a rising channel. There are two trends at work on this 60-minute chart... Read More
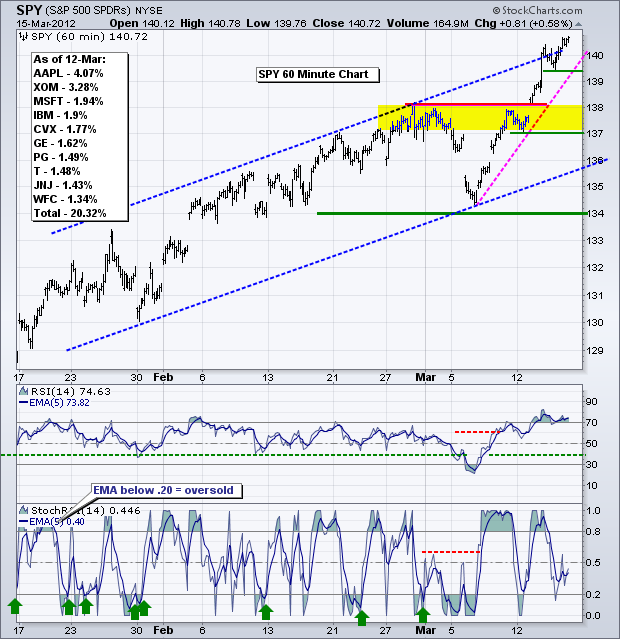
Art's Charts March 15, 2012 at 06:44 AM
Treasuries are falling off a cliff, commodities are softening, gold is plunging, the Dollar is strengthening and stocks remain the best game in town. The recent decline in treasuries suggests that the economy will continue to expand and the labor market will continue to improve... Read More
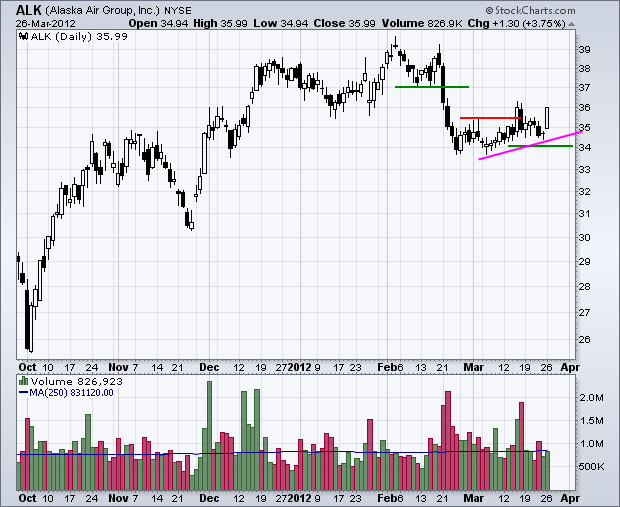
Art's Charts March 15, 2012 at 06:38 AM
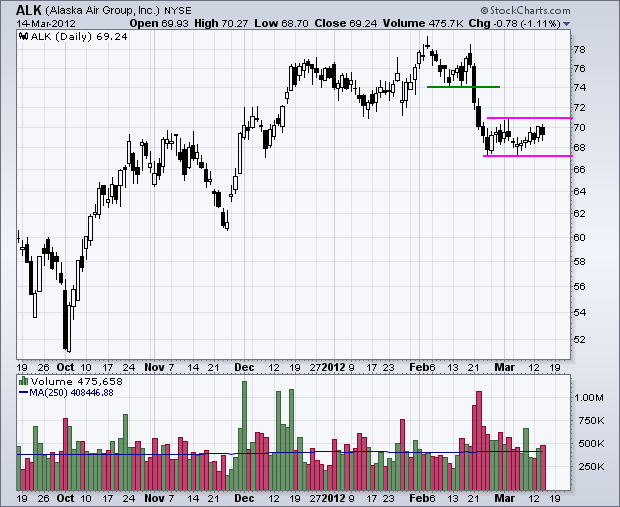
ALK Consolidates after Break Down. MOS Forms Bear Flag on Low Volume. SNDK Falls Back below Tuesday's Low. Plus JOYG, LEAP, TTWO. This commentary and charts-of-interest are designed to stimulate thinking... Read More
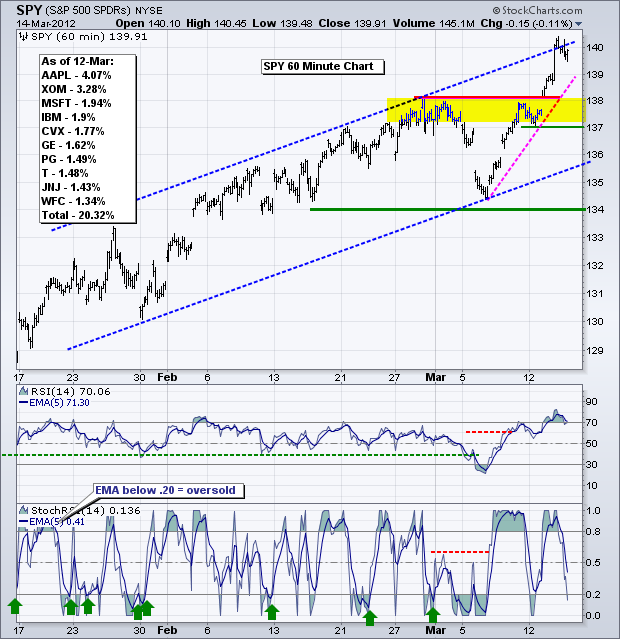
Art's Charts March 14, 2012 at 05:21 AM
Stocks caught a big bullish wind in the final hour and surged with financials leading the charge. Yesterday's surge certainly has the markings of a blow-off top, which is the opposite of a selling climax. However, picking a top in this environment is very dangerous... Read More
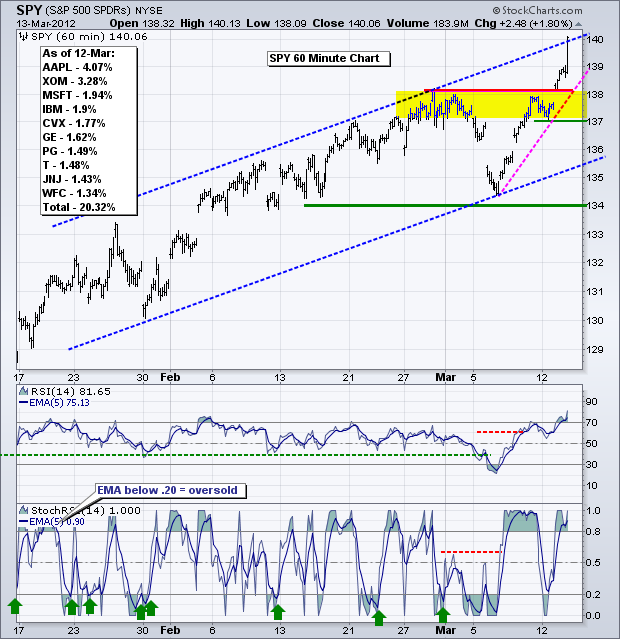
Art's Charts March 13, 2012 at 06:44 AM
Stocks were mixed on Monday with the Dow edging higher and the Russell 2000 edging lower. Sector action was also mixed with technology gaining a fraction and the consumer discretionary sector finishing slightly lower... Read More
Art's Charts March 13, 2012 at 05:44 AM
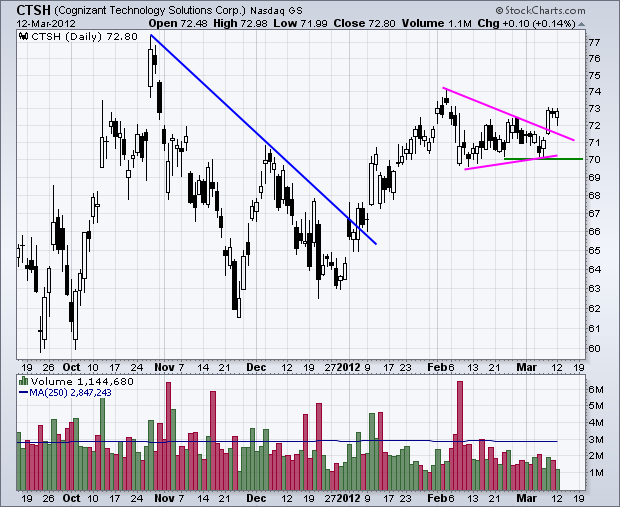
CTXS Challenges Resistance with 3-Day Surge. GOOG Breaks Wedge Trendline with Gap. WCRX Moves Above Channel Trendline. Plus CTSH, DANG, WFT This commentary and charts-of-interest are designed to stimulate thinking... Read More
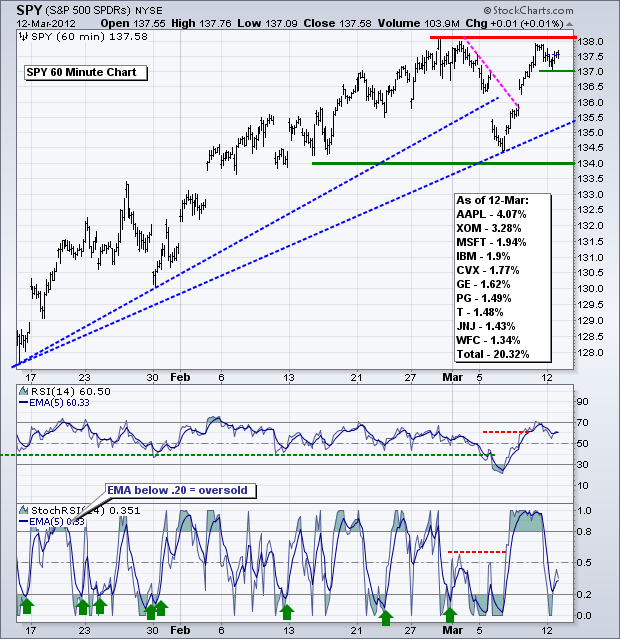
Art's Charts March 12, 2012 at 05:26 AM
After a sharp setback on Tuesday, stocks moved from oversold to overbought in three days. The Russell 2000 ETF (IWM) surged from 78.5 to 81.5 (3.8%), the S&P 500 ETF (SPY) moved back to resistance at 138 and the Nasdaq 100 ETF (QQQ) is challenging its early March high around 65... Read More
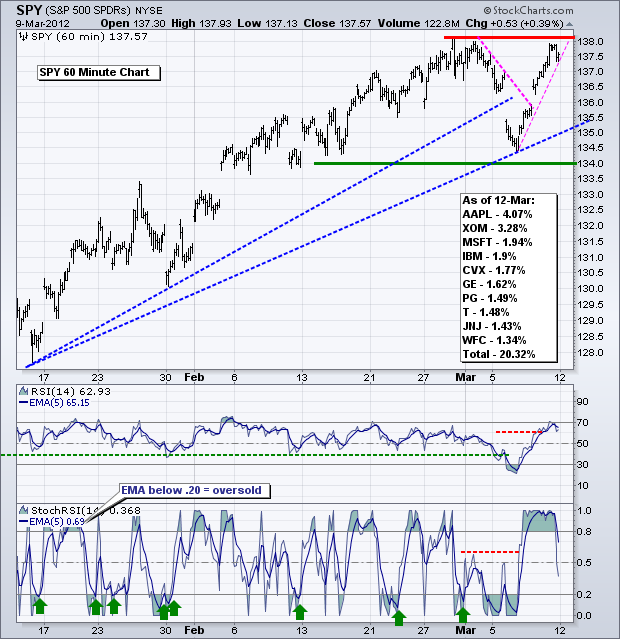
Art's Charts March 09, 2012 at 06:04 AM
The first selling pressure in some three months hit the stock market this week, but the short 1-3 day decline is a mere blip in the bigger uptrend. Stocks were overbought and some sort of corrective period is perfectly normal... Read More
Art's Charts March 09, 2012 at 04:37 AM
There is nothing like the first decent dip after a strong advance. Stocks advanced for some 11 weeks and then corrected hard with a sharp decline Friday-Monday-Tuesday. The S&P 500 ETF (SPY) was down around 2% over these three days... Read More
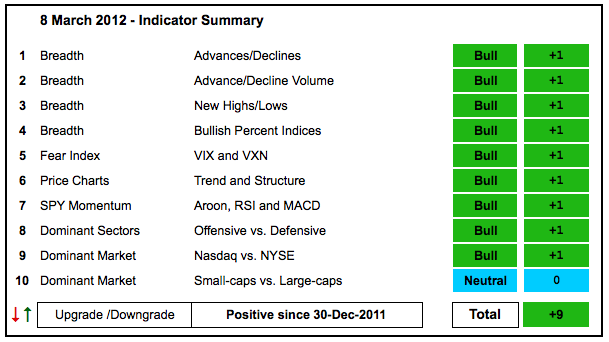
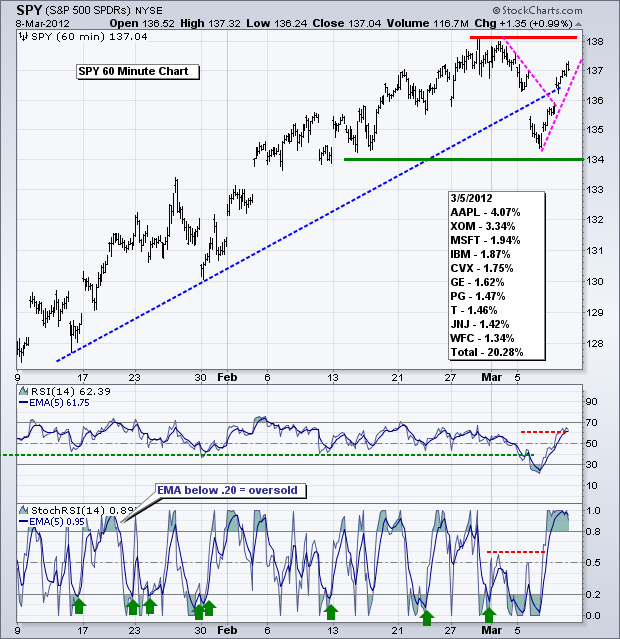
Art's Charts March 08, 2012 at 05:30 AM
After sharp declines that created oversold conditions on Tuesday, stocks firmed and bounced on Wednesday. The S&P 500 ETF (SPY) broke support at 135 on Tuesday, but moved back above this level on Wednesday... Read More
Art's Charts March 08, 2012 at 04:47 AM
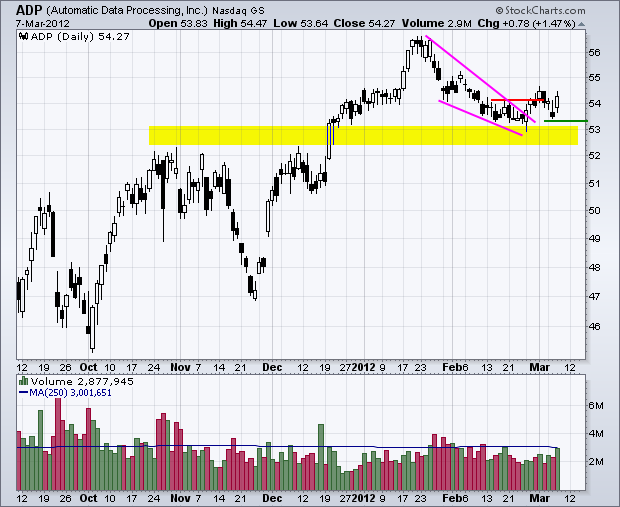
AMZN Consolidates with Triangle Pattern. BMY Consolidates after Breakout. CNP Forms Bull Flag at Trendline Resistance. Plus ADP, ANF, CHKP, TBT. This commentary and charts-of-interest are designed to stimulate thinking... Read More
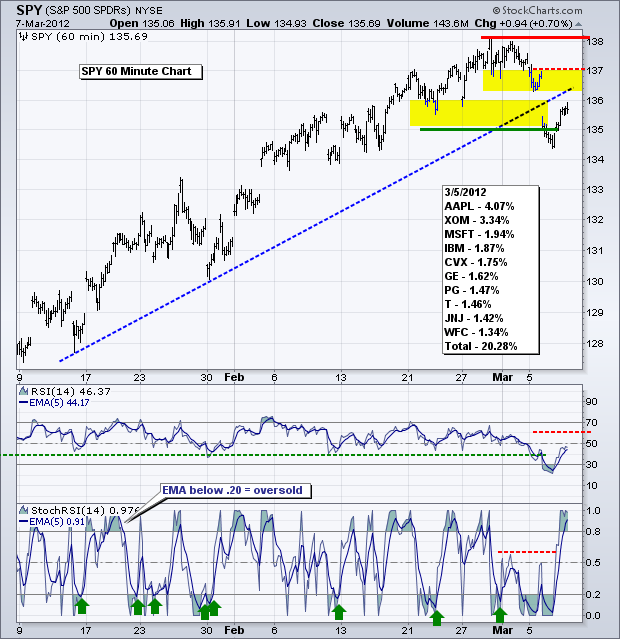
Art's Charts March 07, 2012 at 04:16 AM
Stocks clearly broke down with a broad-based decline on Tuesday. Even though the short-term trend is now down, keep in mind that stocks are already short-term oversold and the medium-term trend is still up... Read More
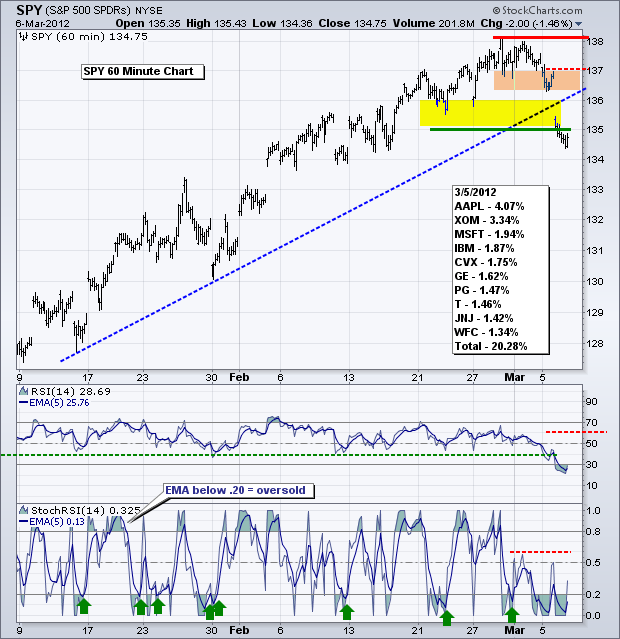
Art's Charts March 06, 2012 at 05:13 AM
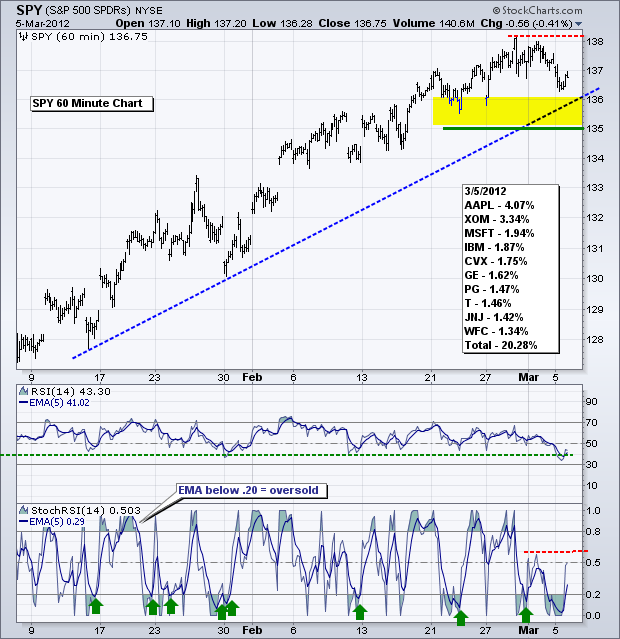
The S&P 500 ETF (SPY) dipped below 137 on Monday. While this is still viewed as a correction within an uptrend, note that RSI dipped to its lowest level since mid December. StochRSI also dipped below .20 twice and failed to break back above the resistance zone (.50-.60)... Read More
Art's Charts March 06, 2012 at 05:03 AM
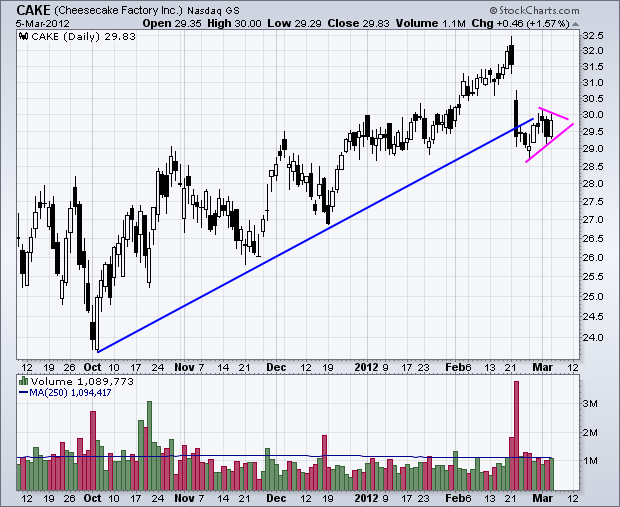
CAKE Consolidates after Sharp Decline. EXPD Surges to Resistance. MRK Bounds off October Trendline. Plus CVH, UIS, UNP This commentary and charts-of-interest are designed to stimulate thinking... Read More
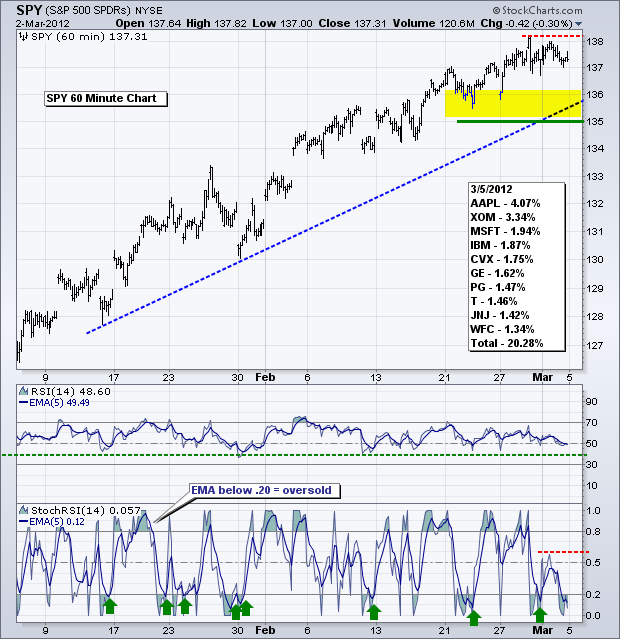
Art's Charts March 05, 2012 at 05:07 AM
The S&P 500 ETF and Nasdaq 100 ETF remain in uptrends, but the Russell 2000 ETF broke support and the Dollar ETF appears to be breaking out... Read More
Art's Charts March 02, 2012 at 05:59 AM
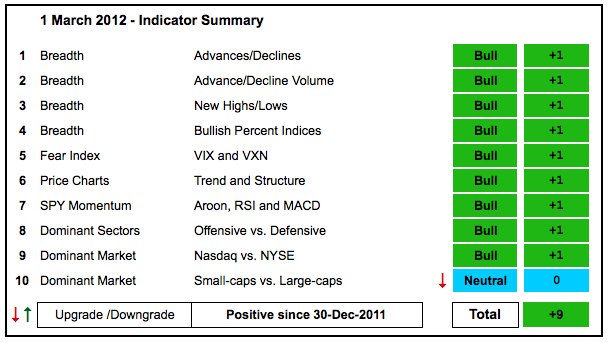
The bulk of the evidence remains bullish, but there was one downgrade on the indicator summary. Small-caps have seriously underperformed large-caps in February and the Price Relative ($RUT:$OEX) ratio moved sharply lower... Read More
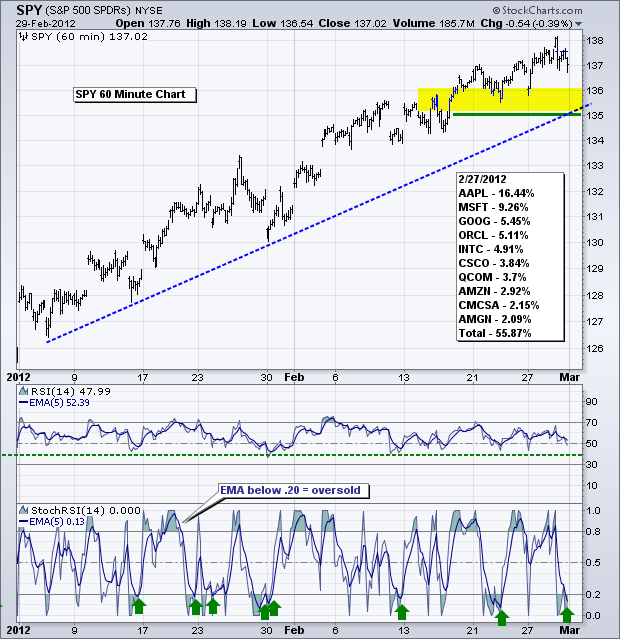
Art's Charts March 02, 2012 at 04:04 AM
The S&P 500 ETF (SPY) remains in an uptrend as buying pressure continues to outpace selling pressure. This is clear by the succession of higher highs and higher lows since December 19th... Read More
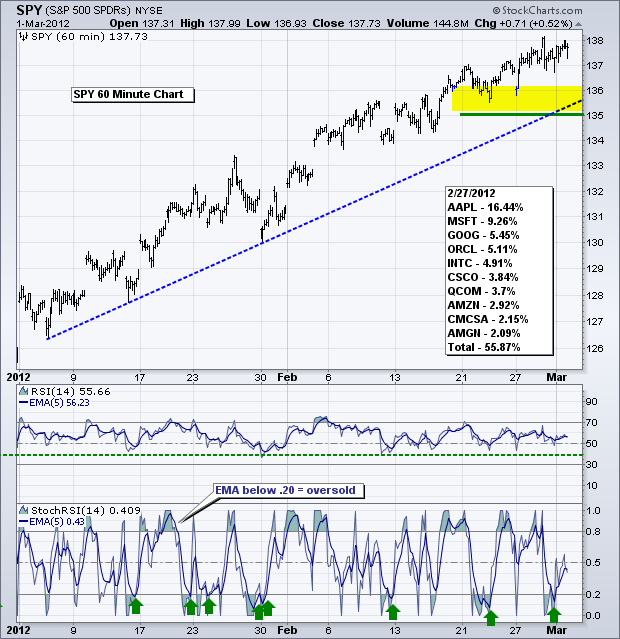
Art's Charts March 01, 2012 at 06:23 AM
Stocks surged on the open with SPY and QQQ hitting new highs for the move, but promptly fell back and the major index ETFs closed with modest losses... Read More
Art's Charts March 01, 2012 at 04:20 AM
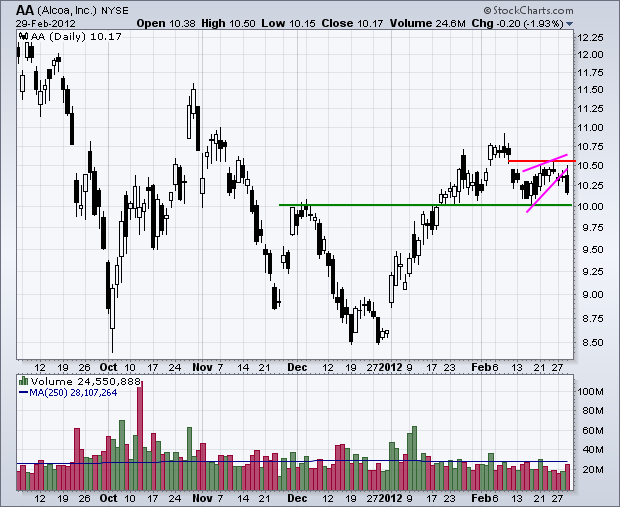
AA Breaks Wedge Trendline. AKS Shows Serious Relative Weakness. BAC Forms Pennant after Sharp Advance. PLus C, DOW, NOC This commentary and charts-of-interest are designed to stimulate thinking... Read More