- SPY Draws a Line in the Sand.
- QQQ Lags SPY on Rebound.
- Scanning for 5-day ROC.
- Auto Parts Stocks Stand Out.
- On Trend on Youtube.
... SPY Draws a Line in the Sand
 ... The S&P 500 SPDR (SPY) and the Nasdaq 100 ETF (QQQ) gapped up the day after the election and did not hold these gaps. These gaps held for two days and the ETFs closed below the gap zone with sharp declines on Monday, which was the fourth day. The inability to hold these gaps is short-term negative.
The first chart shows SPY plunging over 10% with a sharp decline in October and then recouping around 61.8% of this decline with a bounce back to the 281 area. This rebound included two gaps and the last gap did not hold as the ETF failed near the Fibonacci retracement and the mid October high.
 The indicator window shows the 5-day Rate-of-Change, which covers the period from the close on election day to Tuesday's close. Note that this period starts with the post-election gap and the 5-day Rate-of-Change is negative. This means the current close is below the pre-gap close. In other words, the gap did not hold.
At this point, SPY has failed in the 281 area twice and this is the first area to watch for a breakout that could trigger a yearend rally. Note that I am NOT going to point out an inverse head-and-shoulders possibility. First, this is a bullish reversal pattern. Second, the size of the pattern accounts for more than half the decline. Thus, the decline prior to the pattern is simply too small for me to consider a bullish reversal pattern. IMHO!
QQQ Lags SPY on Rebound
The next chart shows QQQ turning down just below the mid October high and just below the 61.8% retracement. This suggests that the bounce in QQQ was not as strong as the bounce in SPY. QQQ filled the post-election gap with a rather sharp decline the last four days and the 5-day ROC is -2.21%, which is almost twice as much as SPY. Thus, QQQ suffered more on this decline and large-cap techs are weaker than the broader market.

Scanning for 5-day ROC
I was also curious to know how many stocks are trading above their election day close and holding the post-election gap. The code below shows a simple scan using the 5-day Rate-of-Change. I am looking for stocks in the S&P 500 with a 5-day Rate-of-Change above zero.
[group is SP500] // group is S&P 500
AND [ROC(5) > 0] // 5-day Rate-of-Change is greater than 0%
Rank by ROC(5) // Rank results by Rate-of-Change
Admittedly, I was a bit surprised by the results because 213 stocks (42.6%) are above their closes just prior to the election gap. This means that 287 stocks (57.4%) are below their election day closes. Stocks with a positive 5-day ROC are holding up better than the broader market. Keep in mind that this is just 5 days and we still need to look at the chart for the full picture. Some stocks dipped below the gap zone and recovered, some are below their 200-day moving averages and some were severely oversold in late October.

Auto Parts Stocks Stand Out
I remain very cautious on the stock market as a whole. My broad market indicators turned bearish in mid October. This suggests that we could see a choppy range, further weakness or a combination of the two. Basically, the environment for stocks is uncertain because of the bearish signals in mid October.
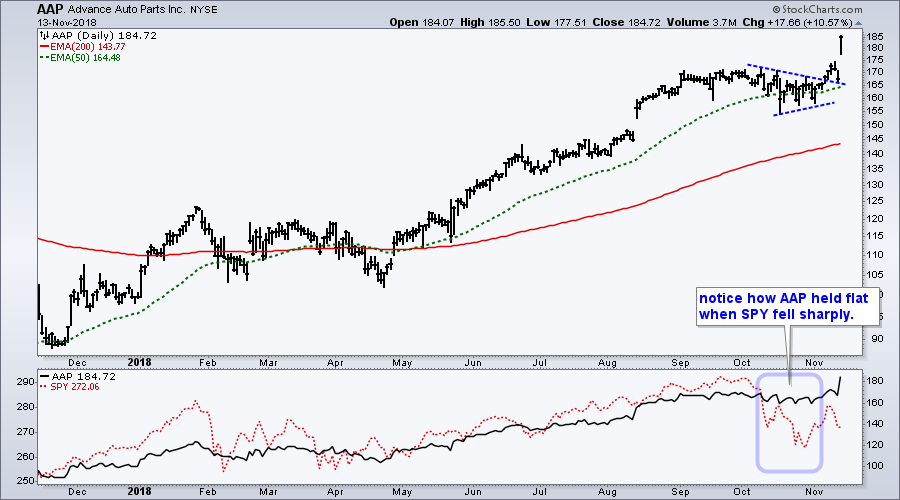
I showed the CandleGlance chart for Advance Auto Parts (AAP) last week and the stock surged 10% on Tuesday and hit a new high. There was a bit of luck involved because the stock reacted positively to its earnings report.
 The next charts show Autozone (AZO) surging to a new high, Genuine Parts (GPC) breaking out of a flag/wedge last week and O'Reilly (ORLY) hitting a new high.


On Trend on Youtube
Here are the topics covered in On Trend, which was recorded Monday afternoon and posted on Tuesday. Also note that the 50-day SMAs for the S&P Mid-Cap 400, Russell 2000 and NY Composite crossed below their 200-day SMAs this week.
Topics for Tuesday, November 12-13:
- Big Advances and Big Ranges
- Failing in Key Retracement Zones
- Appetite for Risk Remains Low
- Charting Weekly Breadth Indicators
- What's Up (Down) with the Big Banks
- Bloomberg Commodity Indexes
- Click here to Watch
Plan Your Trade and Trade Your Plan.
- Arthur Hill, CMT
Senior Technical Analyst, StockCharts.com
Book: Define the Trend and Trade the Trend
Twitter: Follow @ArthurHill
