With the big event coming up on March 9th, Apple (AAPL) will move into a totally new area, wearables. With $150 Billion in horsepower, Apple will release the world's biggest initial product launch ever. Since announcing the first Apple device to mount on your skin, the online world has been a social media marketing dream for Apple.
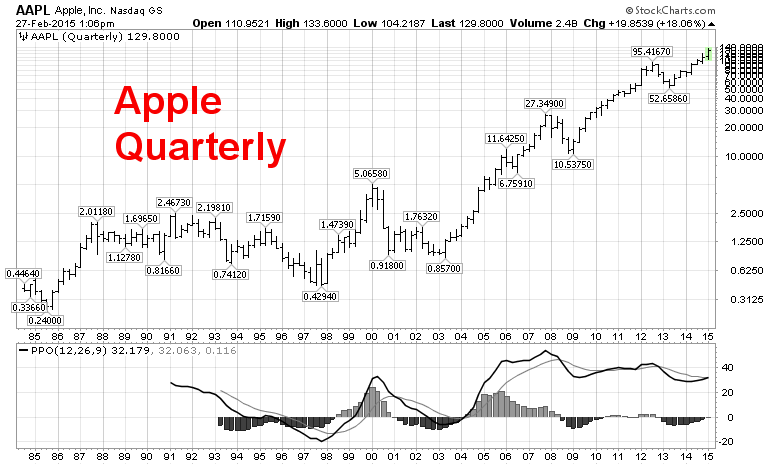
Chart 1
Authors, writers, magazines and news channels have been giving the Apple Watch massive coverage while all the competitors are trying to get some awareness of their product.
I dragged my wife and one of my daughters to the website to check out the designs. They have three different marketing videos. They have 12 different watch pieces. The medley of watch straps is a whole new gig. The combinations and permutations quickly explode for different looks. All this to start a new product line. With the Apple Stores, the online sales, the marketing budget of unknown size, it seems improbable that this won't be some sort of success. With a minimum price of $349 USD and analyst estimates of 20 to 40 Million units worldwide, the expectation for this new product is to sell $7 - $14 Billion worth in the first year! That in itself is remarkable. Launching into a product category that a company has never been in to start with $7 Billion in sales seemed unfathomable only a few years ago. Currently, the investors think this will be a success as they have been bidding up the price of the stock going into the March 9th product launch awaiting the pricing, dates and availability. March 8th is the day to turn our clocks forward for Daylight Savings Time. In Apple's typical style, the product launch, called "Spring Forward", is on March 9th.
Just a footnote here about the prices I will quote in the article. As the stock has split multiple times, the prices are divided to reflect the value from today's real price, but it makes the price at the time look incredibly low.
Chart 2 is the Apple chart without the stock corrections for splits.
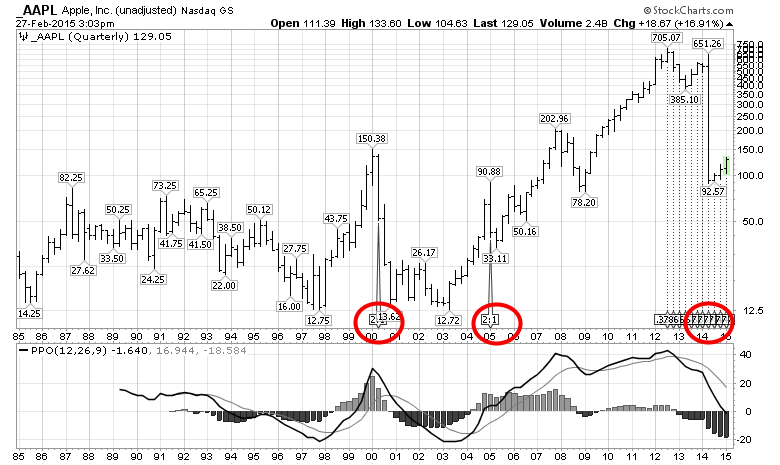
Chart 2
So rather than follow the crowd and spring forward, this seems like a good time to fall back onto Apple's chart history since Steve Jobs sold NeXT to Apple in 1996. I chose to use the sunset backdrop on Chart 3 because it was the end of an era of struggling management when Steve Jobs rejoined Apple. Within a month the stock had doubled, only to make lower lows in the next 5 months around December 1997. The stock doubled again in the following 5 months leading into a new product announcement. The real kickstart to Steve's return was the multi-color iMac. However, immediately after the announcement, the stock fell 20%! The product broke Apple out of an 18 month base and the trend was moving on up. The stock had huge volatility and a move of 30% a month happened at least 3 times in late 1998. 1999 brought the release of the first Apple Laptop that wirelessly connected to a network. The stock doubled again.
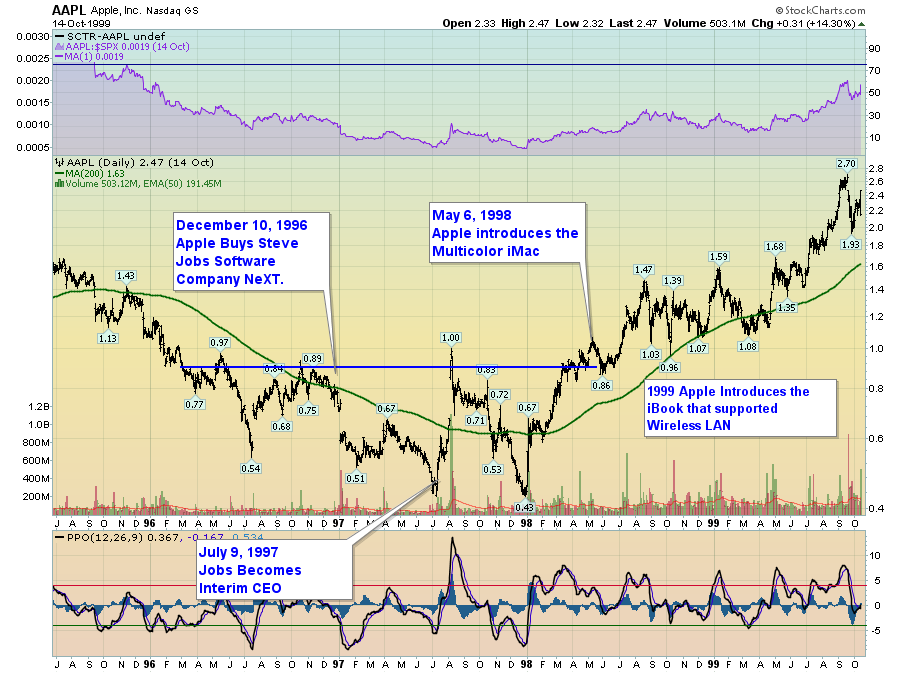
Chart 3
So the chart was off on a new mission. In memory of Spock passing away today, maybe we should say "Its continuing mission: to explore strange new worlds". We now know that to be true for Apple. Apple was reinvigorated with the desktop and the laptop, the investors were invigorated with profits and share price acceleration, and Apple was leaving the base. Think about where and when you would sell the stock or buy as we roll through the charts.
On to 1999 with Apple stock up 500% since Steve's arrival and the computers were selling fantastically. In 1999, the stock went up 370% within a year! I am a big believer in relative strength for stocks as shown in purple which I call the SPURS. Notice when the up trend on the SPURS broke, that was an excellent time to leave the stock. No one knew that the tech crash was starting but this would have been a great signal to take profits after a big run. When the SPURS start stalling after a big run, the moves can be huge. The initial drawdown was 47% in a couple of months! From May until July, Apple continued to whip wildly while the tech sector was imploding. When Apple announced they would miss their earnings estimates on a global slowdown in sales, the stock lost almost 50% on the gap down and 82% in 3 months, below the stock price of the original multicolour iMac. Apple needed a new appleseed to sow to consumers. A year later, in October 2001, Apple launched the iPod. This was shortly after 9/11 and the world was in shock.
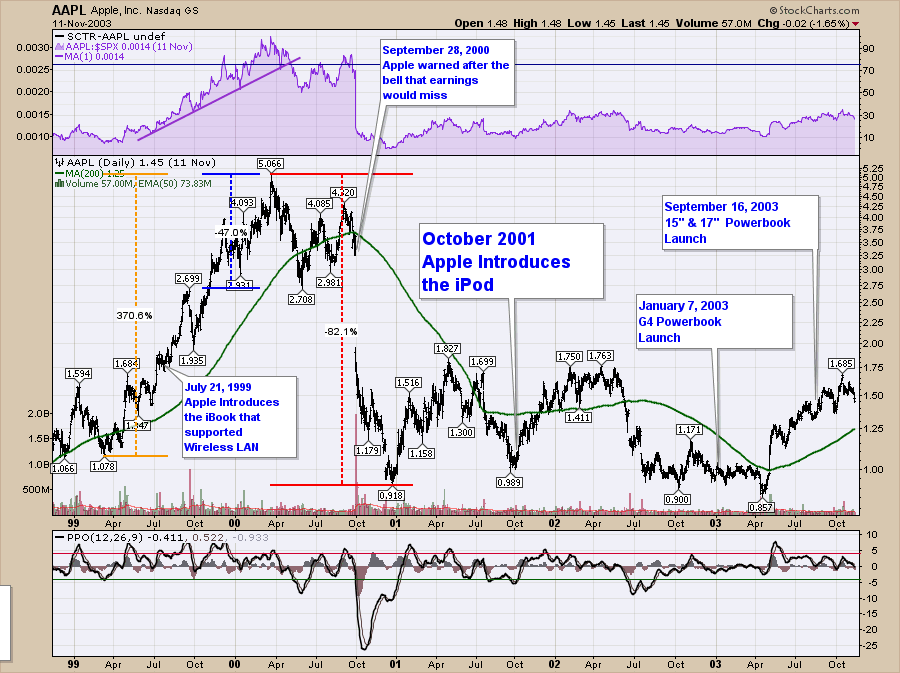
Chart 4
Staying on Chart 4 above, the stock ran up 50% with the newest gadget into Christmas 2001 and continued slightly higher in the new year, only to roll back over and drop to new lows in late 2002 and early 2003. Three great products and the stock was lower than the announcement of any of them. So in the Spring of 2003, the overall market put in the lows and Apple soared like a chinook wind out of the western sky. Actually, maybe it was more like a song from Dire Straits! No love for the stock after three great products with earnings accelerating. From a base of almost a year at April 2003 around the $1 level on the chart above, the stock exploded and doubled in 5 months. What caused the surge? The iTunes store was launched. Now an integral part of the entire Apple ecosystem, the iTunes store launched another rally in Apple stock. Closing out 2003, the Apple chart was back at resistance that had built up in 2000, 2001, 2002 and 2003. The giant gap from 2000 on the chart was ominous to technicians. $1.75 was a serious hurdle.
On Chart 4 above, I have drawn a range on the Percentage Price Oscillator (PPO) of Negative 4% and Positive 4%. The PPO is an oscillator that shows momentum, much like the MACD. The problem with the MACD is that it moves based on the price value and as the value of the stock goes up, the MACD makes higher and lower readings. This makes it difficult to compare over long periods. We know that Apple went from under $15 dollars to over $700 before doing a stock split so we use the Percentage oscillator to deal with the large moves instead. This range of 4% does a good job of identifying when the stock is reaching an extreme, especially after a long run. For example taking profits in late 2001 when the PPO rolled over above 4% after the initial iPod surge would have got you out about 10% short of the final highs. The volatility of the overall Nasdaq in 1999 was extreme so the 4% range was too tight during that period. In general, watching momentum extremes on the PPO or the MACD can help you realize that the stock might be coming to a place you want to get off the ride with near maximum profits. Figuring out when to take profits is always difficult.
On to Chart 5. Apple spent the 2003 through 2007 period iteratively improving the products they had in the market. Annual upgrades of the computer software for a low cost like $29 was extremely helpful in progressing their customers into the future technology. One major step was moving to Intel chips. The stock broke down during 2005 in price action and relative strength compared to the $SPX and the stock lost 20% over 6 months. The 4% filter on the PPO was not enough to handle the surge in late 2004.
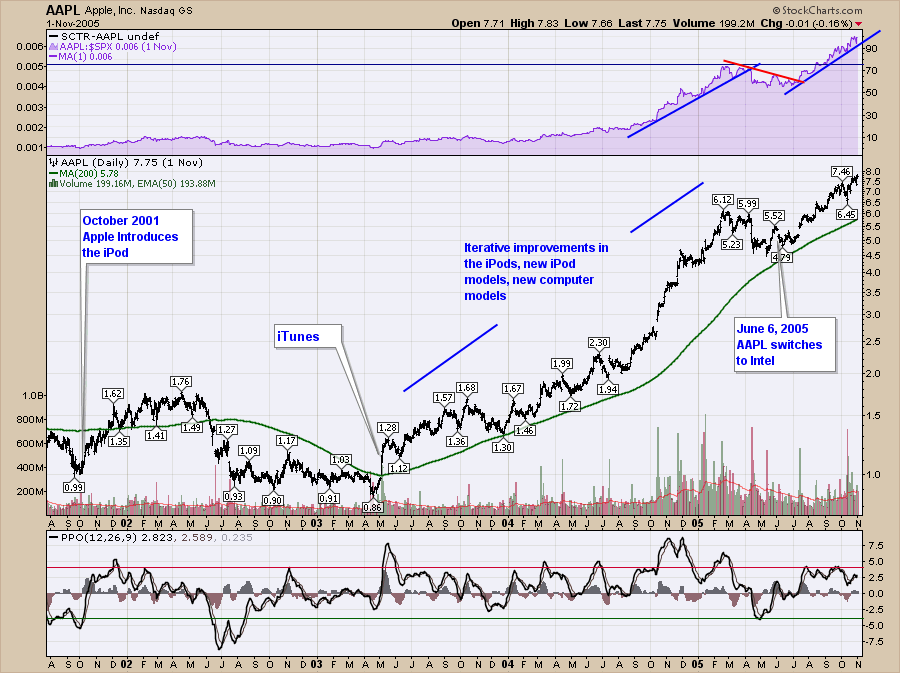
Chart 5
Jonathan Ive and Steve Jobs were hosting live product launches and the media frenzy at every one was growing more intense. At this point Apple is a company with computers and a music device. The investors have ridden an emotional ride, with every failure an opportunity to buy the stock at a better price. The risk of moving to Intel was a big one, but Apple succeeded in moving to the new hardware in 2006. I'll complete this article here and finish with a Part 2.
Good trading,
Greg Schnell, CMT
