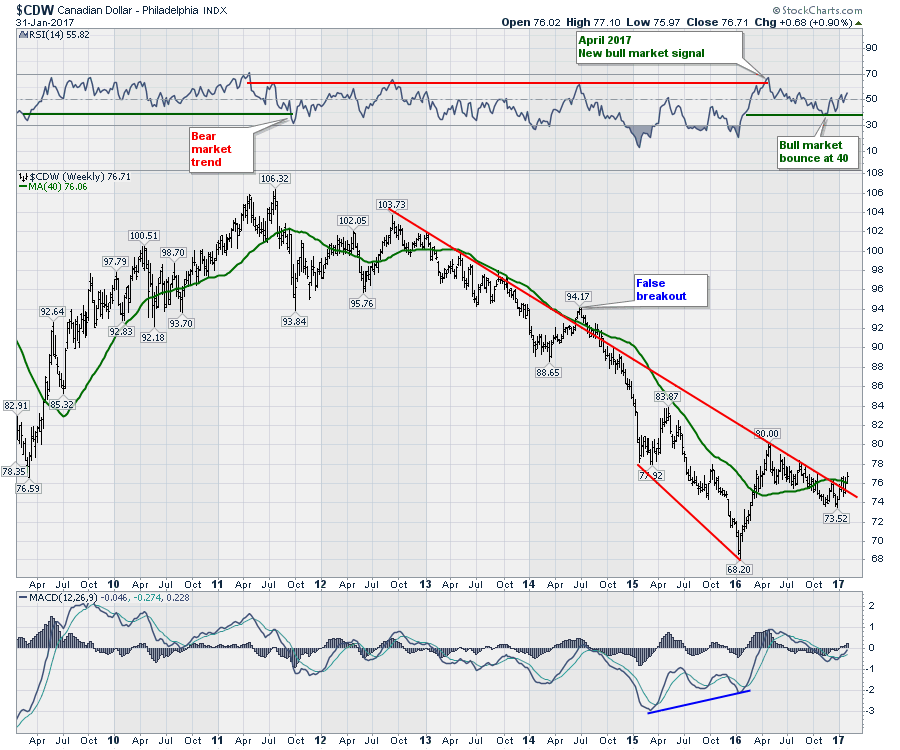
The Canadian Dollar ($CDW) has been in a downtrend for a long time. Deep on the Canadian wish list is a stronger dollar so that things Canadians import from the US would finally get more reasonable.
Looking in on the chart for the Canadian Dollar, we see a break on the chart. However, the chart of the Dollar has a couple of clues on it that makes this breakout more likely to hold unlike the one in July 2014.
Constance Brown did some great work on analyzing the RSI. Here is a link to the book I read, which had a great chapter directed to the RSI.
You can see the period from July 2009 to August 2011 has a green line on the RSI. While the Canadian Dollar was rising, the RSI never dipped below 40.
The RSI holds a couple of great clues that hold true most of the time:
- Bull market RSI readings stay above 40 and usually hit 70 or higher on weekly charts (Green line)
- Bear market RSI readings stay below 65 and fall below 40 on weekly charts (Red line)
The next period on the chart starts with an RSI dropping below 40 and bear markets tend to have RSI's under 65 and down to 30 or lower. When it breaks to the low thirties, that gives a strong bear market signal. Notice how timely the signal was as a clue of a new bear market in the Canadian Dollar back in October 2011 only 3 months after the highs. The bear market runs from October 2011 to the second quarter of 2016. Then we see the RSI pushes up near 70 warning of a change in trend. Now the RSI dipped down to 40 and bounced at the bull market level. I would interpret this as bullish for the Canadian Dollar and trade with that bias.
Looking at price, we see the 40 WMA has been resistance throughout the bear market. There is divergence on the 2015 low with the RSI making higher lows. The MACD also has the divergence confirming the potential for the change in trend.
Now the RSI is pushing higher. We should assume the bull market might be underway. With the trend line break, this looks more likely. The MACD stayed below zero for the most of the bull market. After rising above zero and pulling back just under zero, it now looks to be turning up in the next leg of the bull market.
This chart looks a lot like the recent commodity low in precious metals and industrial metals. Usually, Canada's currency moves in line with the major commodities. This RSI clue could be the biggest clue for not only Canadian investors but commodity investors in general.
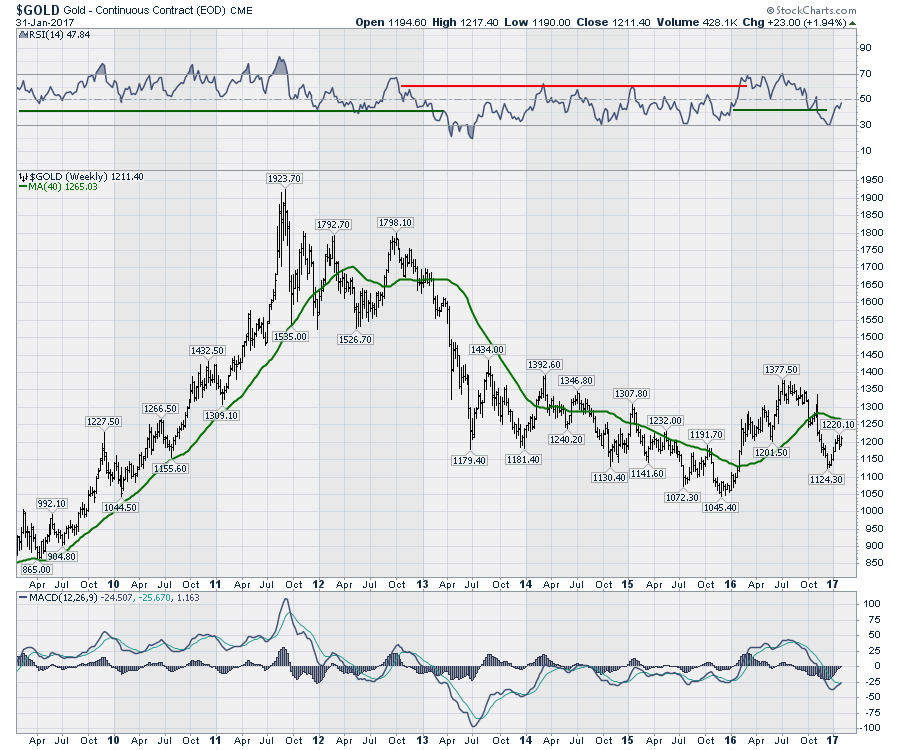
Learning to read the clues on the RSI has been a big help in my understanding of the signals. This works great on weekly charts but on daily charts it gives smaller clues of pullbacks in uptrends. Working that together sounds easy but it is hard with all the little pulses that don't make sense or whipsaws. I have found the weekly charts help me to change from bearish to bullish and vice versa. However, the chart in $GOLD recently went all the way to the 30 level, suggesting the bear market in Commodities is not over. Now look back at the top in Gold and we did not get a bear market signal until much later. The bear market signal finally kicks in during the spring of 2013, well after the highs. But notice the RSI broke down before the price broke down through the $1550 support level. That is helpful information.
 Currency traders typically use more leverage. They are pretty smart traders and adapt quickly on trend changes due to this leverage. Currently, we have a difference in opinion between the two. On the Commodity Countdown Webinar on Thursday February 2nd, 2017, I will try to work through the charts using this RSI tool to help us gather the weight of the evidence. Sometimes the clues don't show up as obvious, but when you get these trend line breakouts, they can be another clue to help you get the direction right.
Martin Pring gave a fantastic webinar on Tuesday afternoon. Market Roundup Live 20170131. Timely clues can really help investors keep more of the major trends. Martin delivered that information in spades today for our members. If you are a member of StockCharts.com, this is a 'do not miss' recording.
If you sign up for a 10 day free trial, you can try all these features and listen in on Martin's webinar. There are so many hidden features in StockCharts.com, you really do have to take the free trial to see all the expert analysis tools that are made available to help you make money in the markets. These tools are helping you find strong stocks in strong industry groups early in the new trend. Click here to sign up for a 10 day free trial and use the coupon code BESTCHARTS to get your first month at half price.
Good trading,
Greg Schnell, CMT, MFTA.
