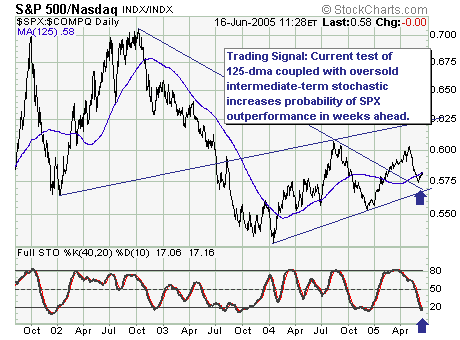
The recent S&P 500 price action above the 1190 level is rather impressive, and can be considered a correction in 'time' rather than in price. This suggests new highs; however, those highs aren't expected to be accompanied by new highs in the Nasdaq Composite.
As the chart shows, S&P 500 large caps have outperformed the technology sector since January-2004 in a 'sawtooth' pattern. I think the S&P 500 is ready to outperform once again...and those hedge funds that want to increase beta via technology will left to their own devices given they are chasing performance. Further, this is suggestive of an overall 'market top' in the weeks/months ahead rather than a continuation pattern. Thus we would be sellers of rallies at the appropriate time.

About the author:
Chip Anderson is the founder and president of StockCharts.com.
He founded the company after working as a Windows developer and corporate consultant at Microsoft from 1987 to 1997.
Since 1999, Chip has guided the growth and development of StockCharts.com into a trusted financial enterprise and highly-valued resource in the industry.
In this blog, Chip shares his tips and tricks on how to maximize the tools and resources available at StockCharts.com, and provides updates about new features or additions to the site.
Learn More