In order to gain a decent perspective as to where we might go in 2009, it's always helpful to take a look at the past to see how we got here. 2008 was a horrible year for the major stock market indices. The Dow Jones, S&P 500, NASDAQ and Russell 2000 lost 33.84%, 38.49%, 40.54% and 34.80%, respectively for the year. It didn't matter where you put your money - nearly every stock index here in the U.S. as well as abroad suffered major financial and technical damage. It's not irreparable damage, but building a solid foundation for a future advance will be a key in 2009. Holding price support at the lows in the fourth quarter is paramount to building that solid foundation.
Clearly, the stock market suffered its worst annual loss in several decades. After all the selling and panic, especially towards the latter part of 2008, the Dow Jones finished 2008 23.66% below where it began this decade. The last time the Dow Jones lost ground during a decade was the 1930's, when it lost 39.64% over that ten year span. The Dow Jones would need to advance 31.00% to avoid having a losing decade. While anything is possible, that seems a tall order especially considering that the Dow Jones had already advanced 15.77% from the November 21st low through year end. Friday, January 2nd did get us off to a great start, albeit on light volume.
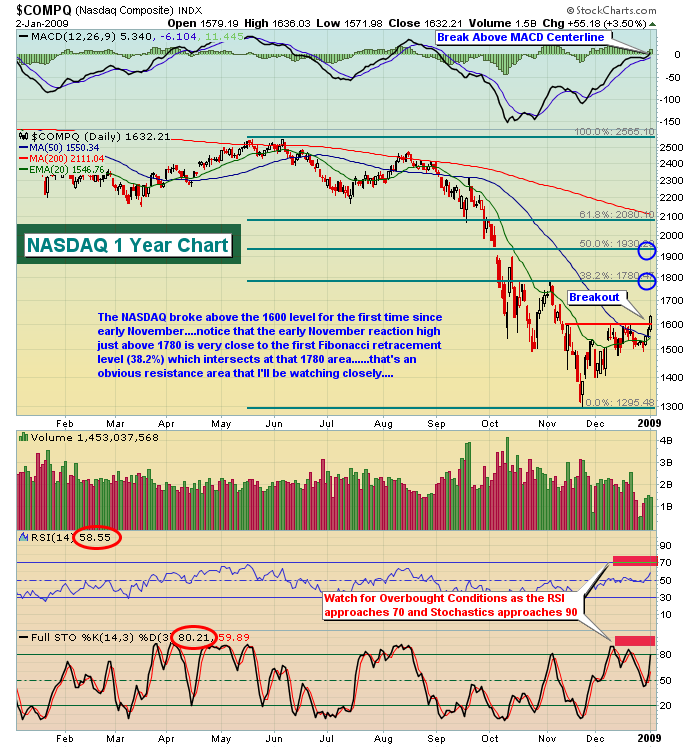
The U.S. stock market remains in a bear market. Despite the surge off of the November 21st lows, we must respect the longer-term bear market message. That doesn't mean we can't continue to advance near-term. In fact, I would be surprised if we didn't rally further during January. Historically, January is the best month for the NASDAQ and is one of the best months for the Dow Jones, S&P 500 and Russell 2000. Technically, if we look at possible Fibonacci retracements of the recent downtrend, we can attempt to pick a price point where the current rally may fizzle. Let's look first at the NASDAQ:
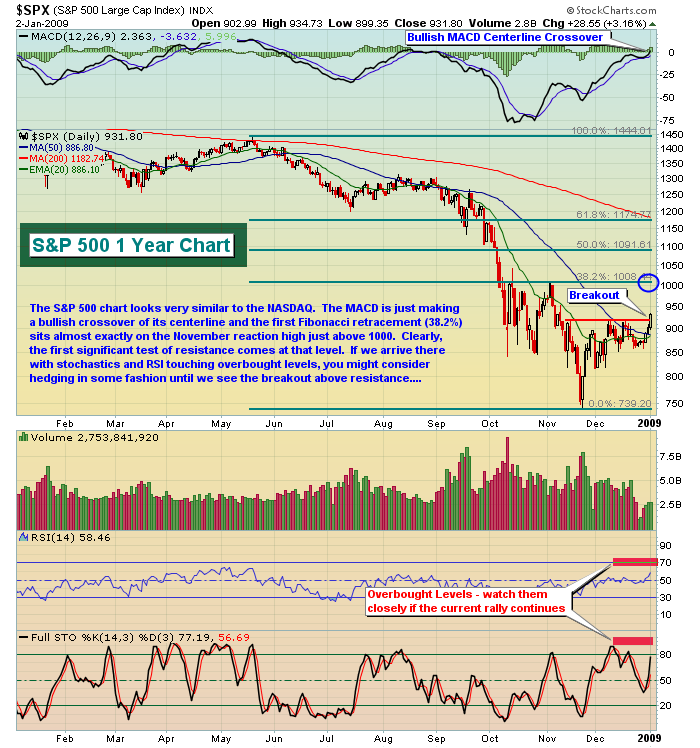
Here's the way the S&P 500 shapes up:
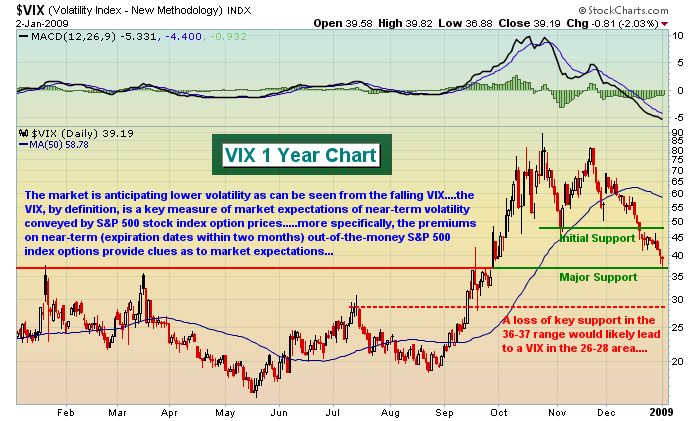
I do believe the market has moved from a very emotional, panic-stricken state to a more stable one. That's not to say we won't see periods of heightened volatility, but the initial shock that was felt in 2008 is behind us and so too is the enormous swings in prices from day to day. That should allow for a period of consolidation where momentum oscillators like stochastics and RSI can be used to more effectively time trades. Pay close attention to these indicators when they flash overbought and oversold conditions, however, because most likely trend changes will be sudden and perhaps without explanation. From the next chart of the VIX, you can see how the emotional roller coaster in the 3rd and 4th quarters of 2008 is finally calming down. Everyone can at least breathe a sigh of relief from that development.
I hope everyone had a very nice holiday season and here's to a healthier and happier 2009!
Happy trading!


