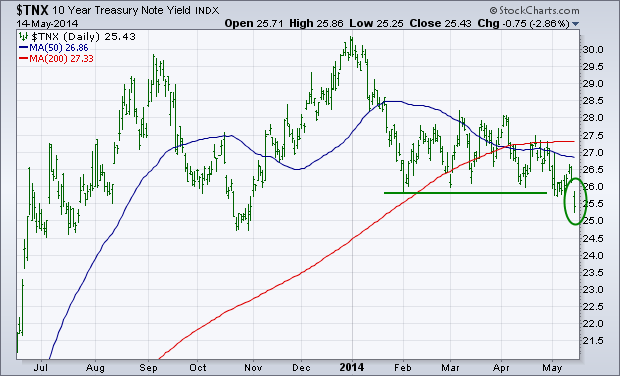
The first chart below shows the 10-Year Treasury Note Yield (TNX) falling below its early February low in trading on Wednesday. That puts the TNX at the lowest level since last October. Normally, a falling bond yield signals that investors are turning more pessimistic on the economy. That seems strange considering that the Dow and S&P 500 have just hit record highs. The discrepancy between falling bond yields and rising stock prices is just another sign that the recent large cap rally may not be as strong as it appears.
The next chart shows the divergence between the falling Treasury yield and a rising S&P 500. The downturn in bond yields in January coincided with a pullback in stock prices. Both then stabilized at the start of February. Since the start of April, however, falling bond yields have diverged from a rising SPX. Today's breakdown in bond yields makes their divergence even more striking.
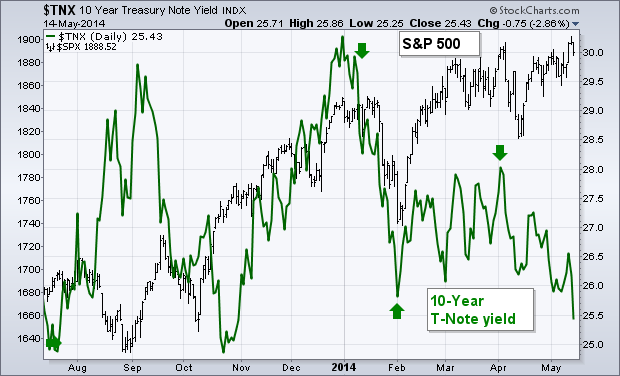
Something seems wrong here. One of the two markets is sending the wrong message. The question is which one.
- John
