It's been quite confusing for several reasons, a few of which are discussed below.
Historically, the S&P 500 nearly always struggles during the balance of a calendar year in which January performance is weak. In January 2014, the S&P 500 fell 3.56%, ranking it in the bottom quartile of all Januarys since 1950. That rarely bodes well for equity performance over the next 11 months, yet the S&P 500 has risen in every calendar month since January and is up roughly 200 points and more than 11% since the end of January. History has misled us - at least through June 30th.
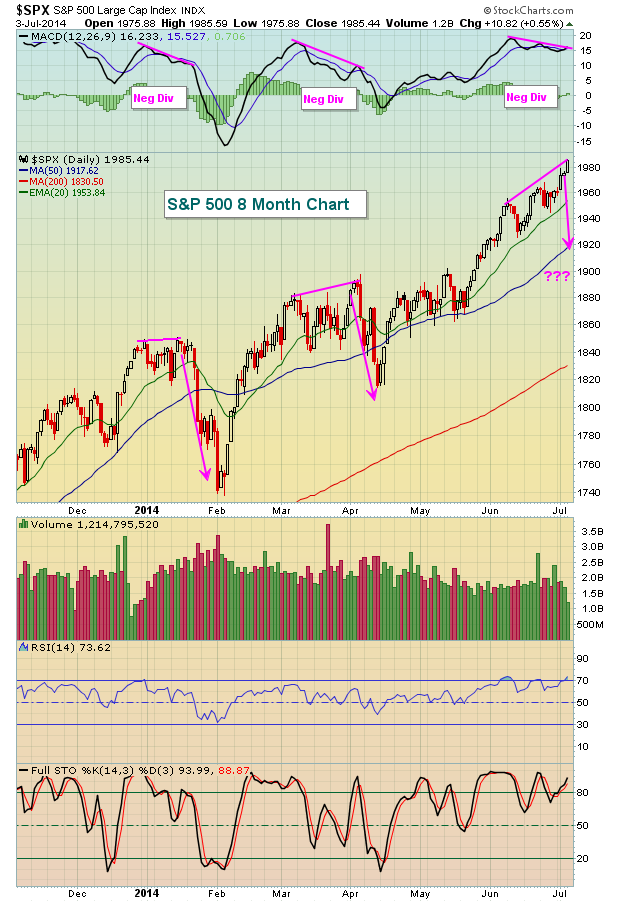
Technically, the bulls have been fighting an uphill battle all year - and winning. There have been multiple negative divergences on the S&P 500 chart. Twice in 2014 already, it appeared the bulls lost their momentum, but after brief periods of selling, that momentum returned. Currently, there's another negative divergence as we head into earnings season. Will it matter? Check it out and you be the judge:
That's a short-term issue that can be easily corrected by a period of unwinding. There's is a bigger picture concern, however. Much of this 2014 rally has been led by defensive areas of the market - utilities, consumer staples, healthcare, REITs. We have begun to see leadership from aggressive areas of the market again and that's important. Traders need to be willing to take risks in order to sustain advances - at least that's what history tells us. Check out the relative strength of defensive areas of the market throughout this 2014 rally - especially when equities broke out in March/April:
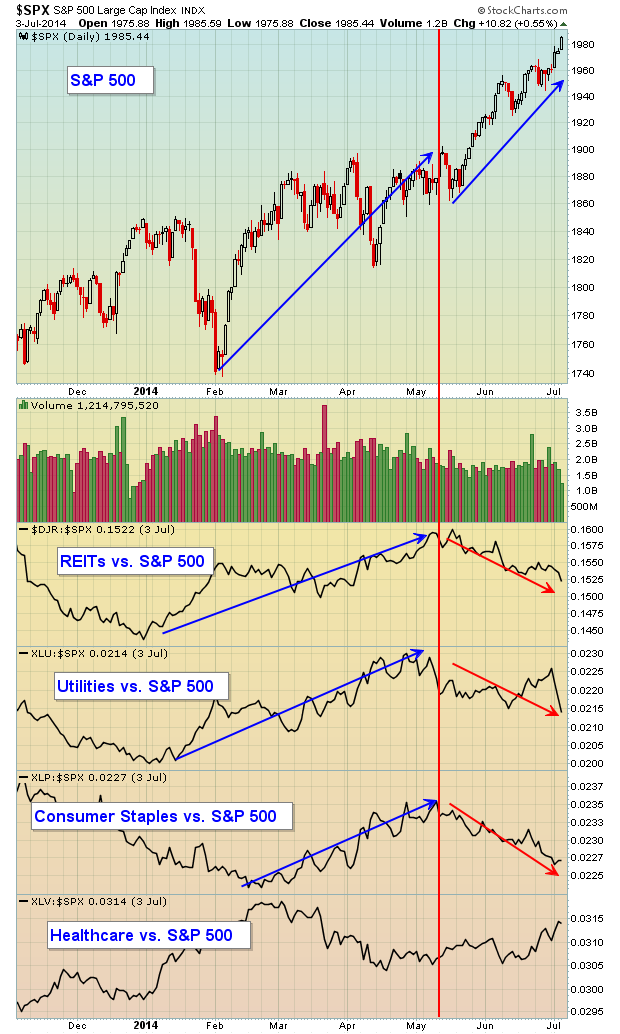
The past couple months do look better and that's good news for the bulls. The recent push higher has seen the relative strength of defensive stocks deteriorate, which is exactly what we want to see. It will be important to see money continue to rotate away from safety.
Later this week, I'll be hosting my annual Mid-year Market Outlook webinar where I'll be discussing the second half prospects for each of the sectors and many industry groups. While many market pundits follow the "Go away in May" theory, my research tells me it's more like "Go away in mid-July". I'll discuss that historical tendency in detail in this webinar as well. For more information on how you can participate, CLICK HERE.
Happy trading!
Tom Bowley
Chief Market Strategist
Invested Central


