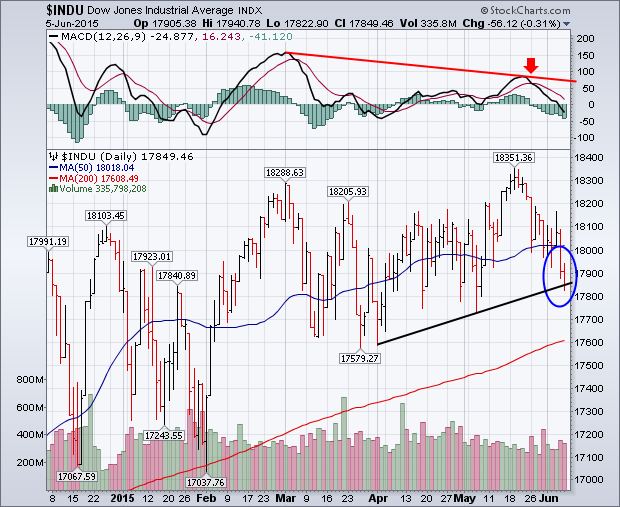
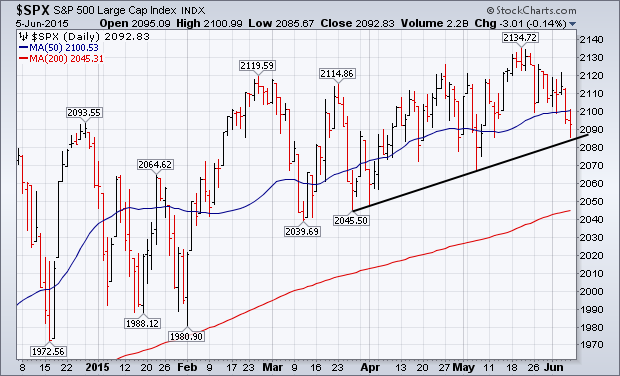
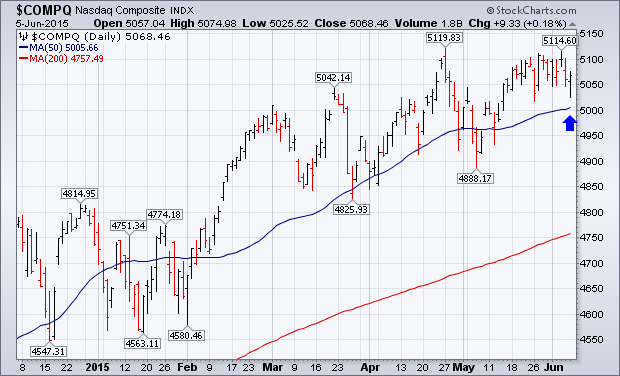
U.S. stocks lost ground during the week, but not enough to do any serious chart damage. Chart 1 shows the Dow Industrials falling to the lowest level in a month and sliding below its 50-day moving average (in rising volume). But the Dow has yet to break a rising support line drawn under its April/May lows. Chart 2 shows the S&P 500 looking pretty much the same. The Nasdaq, however, held relatively steady. Chart 3 shows the Nasdaq Composite Index bouncing on Friday to end the week essentially flat. It also remains above its 50-day moving average. Although the broader market lost ground, it's doubtful that it will fall very far as long as the Nasdaq market continues to hold up. A lot of negative divergences pointed out over the last week remain intact (like the falling MACD lines on top of Chart 1). That situation will have to improve to signal that the market is out of danger.