 Hello Fellow ChartWatchers!
You know, sometimes we overthink things. Actually, in the realm of Technical Analysis, overthinking things is an epidemic! People are constantly asking us for more indicators, more tools, more features more data - more, more, more! "If I just have this one additional thing, then I will have everything I need to make money in the market." Hog wash.
The fact is StockCharts will continue to provide a huge collection of proven, helpful tools and indicators for everyone who wants to use technical analysis in whatever way they want, but I have to tell you - for 99.999% of you out there - we already have everything you need. Just overcome whatever "analysis paralysis" you have and start using our basic stuff to make better investing decisions!
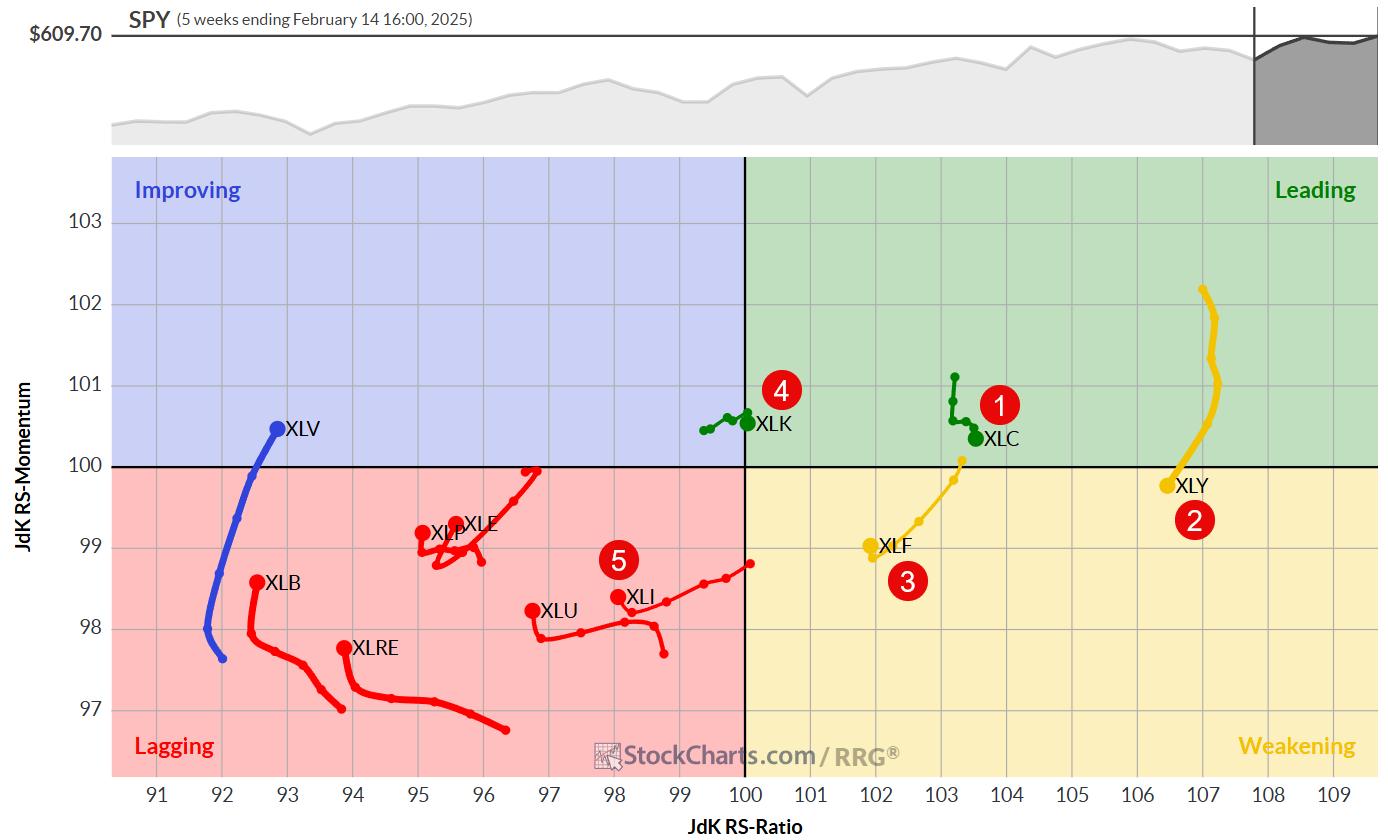
Specifically, look at stocks with great relative strength and strengthening momentum and use stops to manage risk. In other words, be a momentum investor.
That's it. Great relative strength and strengthening momentum. From a technical perspective, that's all you need to focus on. Until you have those three concepts mastered, there's not much point in looking at other areas of technical analysis - they are just "optimizations" that can often lead to trouble. I'm totally serious.
Q: "OK Chip. How then do I find stocks with great relative strength and strengthening momentum?"
A: Glad you asked! Look at stocks with high SCTR values. Next question?
Q: "Wait. That's it? High SCTR values? How high? (also, what's a SCTR?)"
A: SCTR stands for StockCharts Technical Rank - a number between 0 and 100 that tells you how strong a stock is technically relative to the other stocks in its group (e.g., large caps, mid caps, etc.). Stocks with rising SCTR values above 75 have great relative strength. They are your hunting ground. Until you are 100% positive that none of the stocks in that category are for you, there's no point in looking elsewhere.
To see the specific stocks I'm talking about, go to the StockCharts homepage and click on the "SCTR Reports" link located immediately below the yellow chart. Next, select the group (large cap, mid cap, small cap, etc.) you are interested in from the dropdown at the top of the page. Boom! There's your list sorted by SCTR. Start at the top and work your way down until you find something you like. (You can also watch this weekend's ChartWatchers LIVE webinar for tips on SCTR scans.)
Q: "Wait. How do I know if I like one of these stocks?"
A: Its chart looks like this:
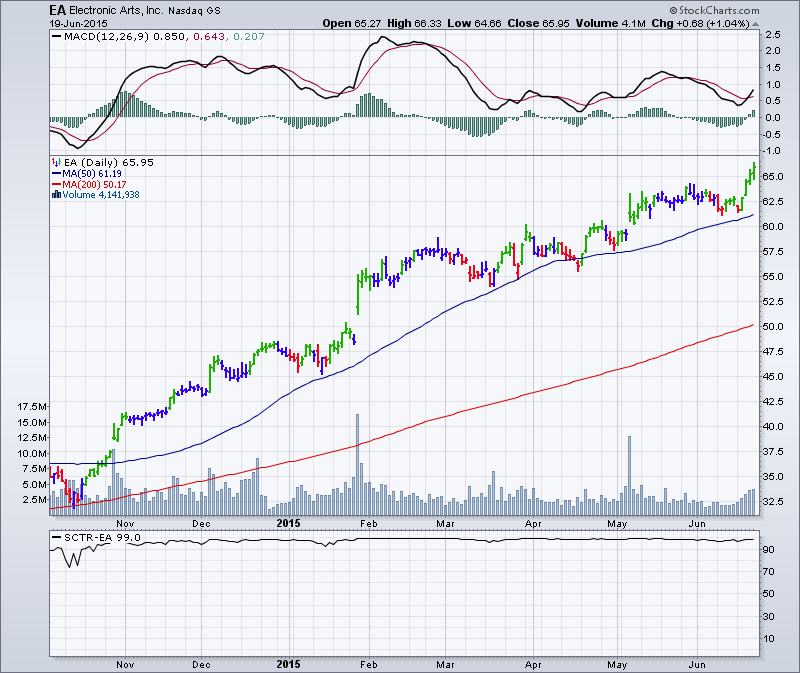
Long, steady uptrend with a positive, increasing MACD line, and - ideally - lots of green Elder bars. If the chart doesn't look like this, move on. Lots of other charts do.
Q: "Hang on. That stock looks pretty overbought to me. It has been in an uptrend since at least last October! Haven't we missed that move?"
A: That is the #1 over-thinkers fallacy in my opinion. Here's a question for you. Don't you wish you'd bought EA back in December when it was at 45? Absolutely, right? Now, look at the chart of EA back in December:
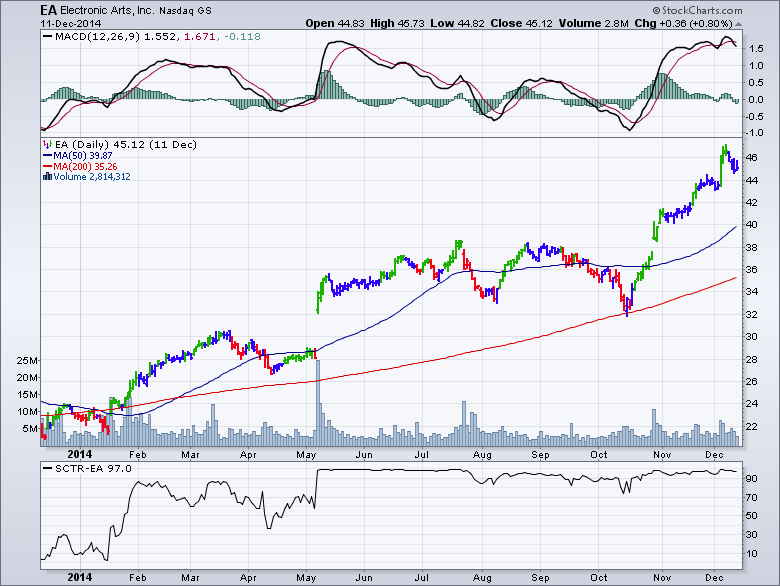
Wait a second! This chart of EA in 2014 looks just as "overbought" as the current EA chart doesn't it? Yes- yes it does. And that's my very, very important point. To put it another way:
In order to be someone who profits by getting in in the middle of a big move, you have to be someone who is willing to buy at "the top."
No matter when you buy, the stock might be at "the top." That doesn't mean you should go into analysis paralysis and never trade. You simply need to employ good risk management strategies (including stops) so that if the stock does turn against you, it won't hurt you. BUT HERE'S THE IMPORTANT POINT: Stocks with great relative strength and strengthening momentum will continue to rise much more often than not. In the long run, riding well established trends (with good risk management) is a far more reliable way to find winners than trying to pick turnarounds or brand new trends.
Q: "Where can I learn more about these "good risk management strategies" you are talking about?"
A: Simple - "Trading for a Living" by Alexander Elder. Read it. Twice. Gatis Roze's blog is another awesome resource for trading skills.
Now, a word of warning. Because I used it as the example in this article, EA will - of course - tank on Monday. It's pretty much guaranteed. But even if that happens, don't overlook (or overthink) my message. Just move on and find other stocks with great relative strength and increasing momentum - they are always out there somewhere. Our SCTR Report page can definitely help you find them.
Take care,
- Chip