As we approach the end of the third quarter in 2015, it's time to unveil a few "Best Of" awards as they pertain to the NASDAQ 100. Let's get this party started:
Best Buy & Hold
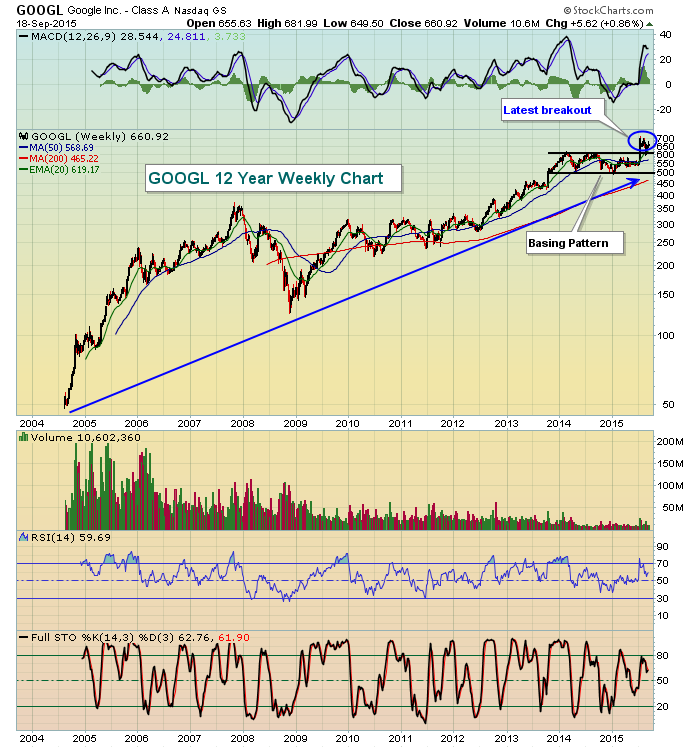
Google (GOOGL). The long-term chart speaks for itself. You do have to deal with some volatility here. If you're not sure what I'm referring to, I'll simply point you to 2008. The bear market was devastating, but nearly all the losses were gone by the end of 2009. After a stellar 2013 and early 2014, GOOGL paused for more than a year before recently turning higher on superb earnings. GOOGL broke out of its basing pattern on increasing volume and has been a relative standout considering the overall market environment. And I don't know about you, but I don't "search" the internet, I "google" it. Here's the chart since GOOGL went public:
Honorable Mention: Starbucks (SBUX) - has been a nice, quick recovery off recent lows. Nothing seems to hold SBUX down for long and I've even frequented this restaurant once or twice. :-)
Best "Under The Radar"
Amazon (AMZN). Typically AMZN gets plenty of media time so to say this company is "under the radar" might be a stretch. But let me ask you this. After Thursday's Federal Reserve debacle and final hour collapse in our major indices, did you realize that AMZN closed at an all-time high? And on Friday with all of our major indices dropping more than 1% and failing to hold 20 day EMA support, did you realize that AMZN completed the exacta with yet another all-time high close? That's what I mean by "under the radar". While the Dow Jones was falling 600 points from just before 3pm EST on Thursday to just before the close on Friday, AMZN managed to close at consecutive all-time highs. I think that's worthy of this award and I'll go out on a limb and say AMZN will test its intraday high of 580 before it reports its latest quarterly results in October. Why is AMZN so strong? Well, part of the reason could be seasonality. If you don't check out seasonal performance, you're not doing yourself any favors. Take a look at how AMZN performs historically during the month of September:
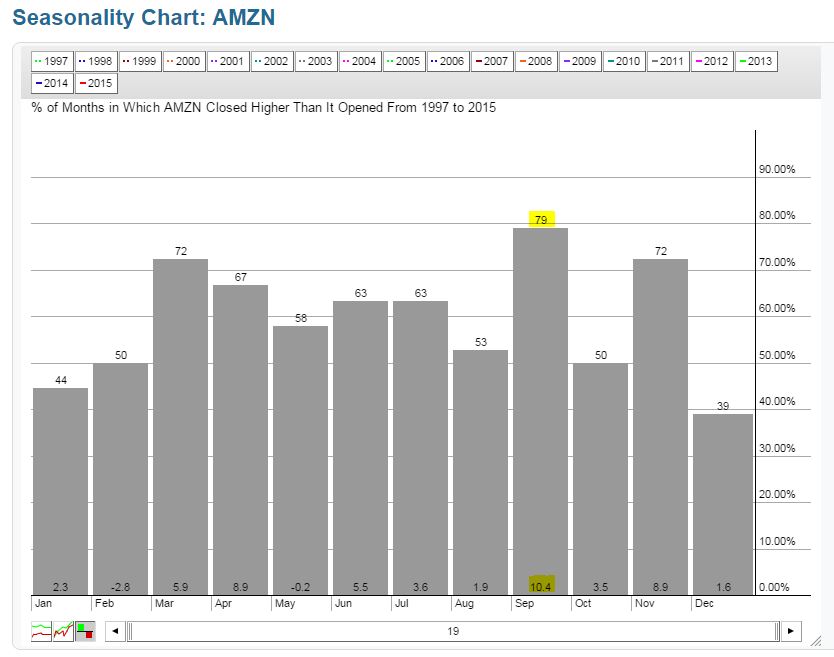
I've highlighted two facts about AMZN's performance during September. First, its stock price has risen during the month of September 79% of the time - better than any other calendar month (back to school perhaps?). Second, AMZN has AVERAGED gaining more than 10% during the month of September over the past 19 years. 10% is a great YEAR for most stocks.
Honorable Mention: Sirius Satellite (SIRI) - it's been basing for a long time. Don't fall asleep. Increasing volume and a push through the 4.05-4.10 area would be a big deal technically.
Best Technical Setup
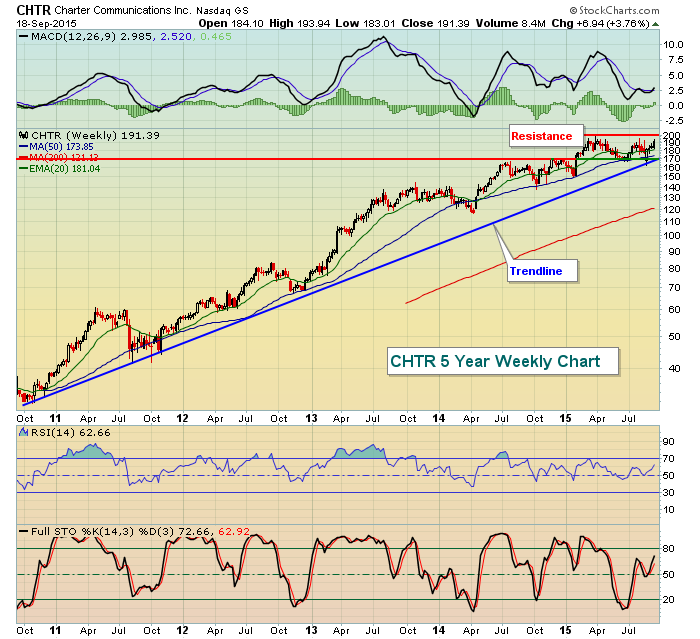
Charter Communications (CHTR). There wasn't a lot of competition for this award as most NASDAQ 100 stocks are still reeling from the wrath that was August. CHTR is a nice looking stock that's been trending higher for years. Recently, however, it's been consolidating within a trading range from 170-200. It's no longer overbought and is just a day or two away from a potential breakout despite the poor market environment. Unlike AMZN, September has not been particularly kind to CHTR so the breakout here might have to wait for more seasonably favorable conditions found in the fourth quarter, especially in November and December. Here's the current chart:
Honorable Mention: priceline.com (PCLN) - recently challenged March 2014 high and appears to be in cup with handle pattern. On breakout, measurement (target) is 1750.
Best Horrible Looking Chart
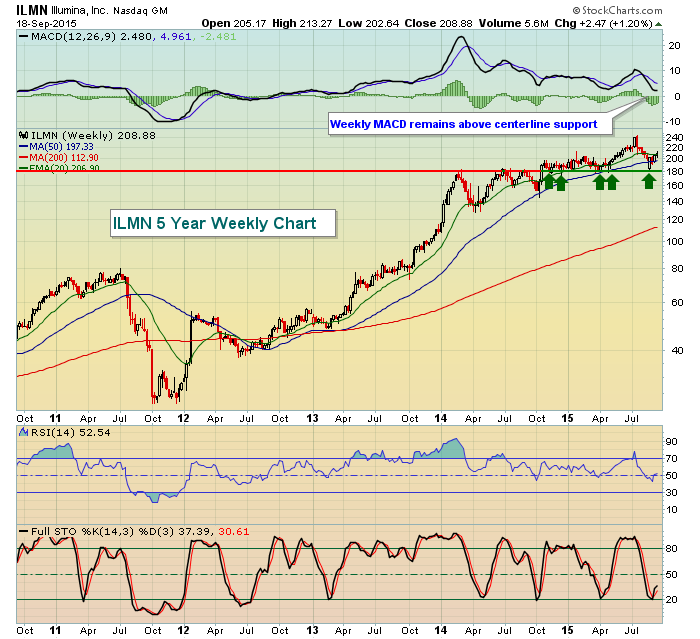
Illumina (ILMN). There was a TON of competition for this award as most of the NASDAQ 100 features charts with ugly technical conditions, especially on the shorter-term daily charts. ILMN was no exception on the daily chart, but it does have a bullish longer-term chart with its series of higher highs and higher lows intact. The August low near 180 simply tested prior lows near that level throughout the past year. Check out this weekly chart:
Honorable Mention: Netflix (NFLX) - been a tremendous performer, but not desirable on a daily chart at this time. However, given the strong volume trends, anything close to that August low below 90 would be an interesting reward to risk entry.
Have a nice weekend and happy trading!
Tom
