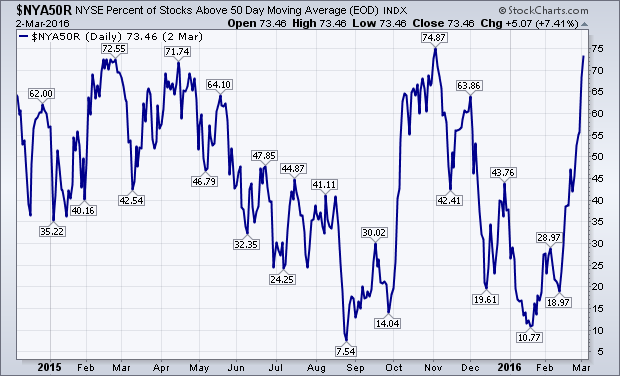
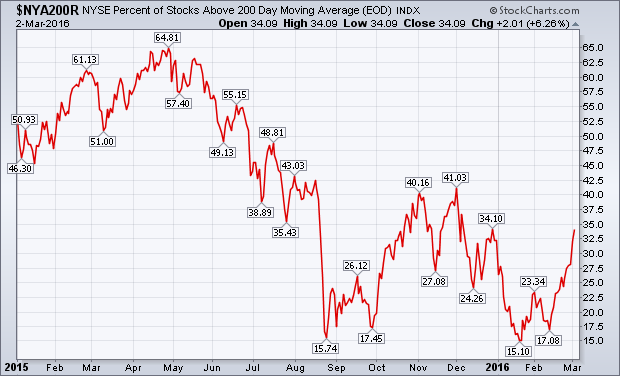
A lot of attention is now being paid to stocks testing or exceeding their moving average lines. My February 20 message had a headline suggesting that the percent of NYSE stocks trading above their 50- and 200-day moving averages might be bottoming. Let's take another look. The blue line in Chart 1 shows the % of NYSE stocks above their 50-day lines. Since February 20, that line has nearly doubled from 38% to 73%. That reflects the short-term improvement that's taken place over the last month in major stock indexes. That line, however, is nearing an important test of its early November peak at 74%. What it does near that resistance barrier will help determine if the short-term rally has more staying power. Chart 2 shows the % of NYSE stocks over their 200-day lines. It has risen from 23% to 34% since we last looked at it. That means that roughly a third of big board stocks are back in uptrends. While that's encouraging, it's not conclusive enough to signal a major bottom. For that to happen, the red line would have to clear its fourth quarter high at 41%. We'll be watching.