
If the market this year has taught us one thing it's that it's as easy losing money when the market is going up as when it is going down. Consider this.
After the first trading day of the year was over, the S&P closed at 2012. This past Friday the S&P got as high as 2009 before closing just below 2000. So for a brief moment, the S&P had changed just 3 points from the first trading day of the year up until Friday.
Now, if someone had taken a long nap from December 31 up until Friday and looked at the S&P when they woke up, they would think that not much had gone on during their long sleep. Wrong! What they would not know is the S&P lost 12% from the close on December 31, 2015, to the low of 1810 on February 11, 2016, and then gained over 10% from that February 11 low toFriday's close. That's an awful lot of volatility over just a few months.
While all of this was going on the bulls learned painfully that holding stocks on the long side in a falling market can be hard on the pocket book. But then the bears who continued to hold short positions as the market climbed found their pockets had been emptied as well.
Anyone who has followed the market as long as I have knows that the masses often exit the market when the threshold of financial pain becomes unbearable. This goes for those who hold on stubbornly long when the market is falling as well as those who hold on short when the market is rising and who move to the sidelines only to watch in misery as the market reverses. By the time they are ready to jump back in it is likely after the bulk of the gains on the long or short side have already been made. Rinse and repeat.
So, what can one do?
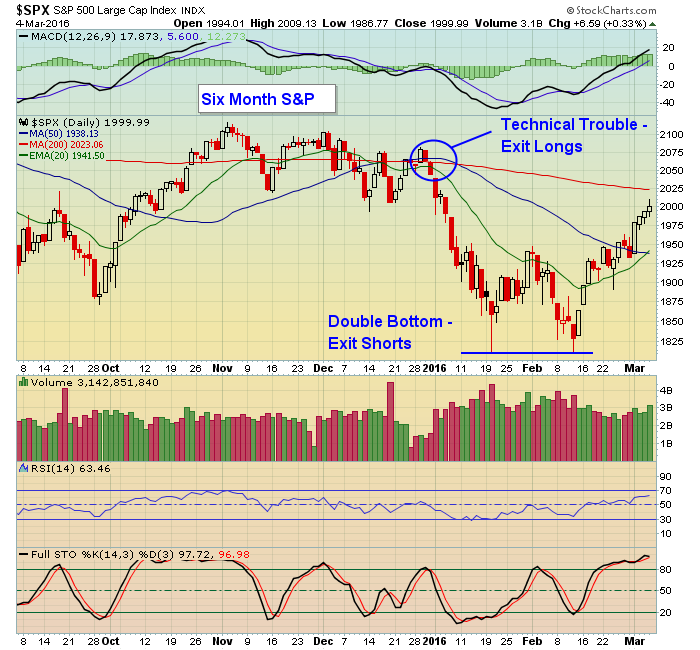
You can start by looking closely at some tried and true technical indicators that provide critically important clues. For example, in the chart below look at what happened once the S&P closed below all key moving averages on December 31. It was straight down. So, holding on to long positions from that point and over the next three weeks would have caused undue financial pain. And those who were on the short side when the S&P hit its low of 1810 and who "felt" the market would continue lower yet held on to their positions are now left wondering how high the market might go if it clears yet another key level, the 200 day moving average, now at 2023. And with that worry comes an awful lot of worry and short covering and money down the drain.
 They say hindsight is 20/20; that it's always easier to see something after it has occurred. But if you are willing to keep an open, unbiased mind, there are always very visible clues on the charts as well as other possible strategies that can help to minimize the financial pain. Even then trading is a tricky business and one that requires discipline at all times.
For those interested, I will be joining Tom Bowley, Senior Technical Analyst at StockCharts.com during his Wednesday webinar this week where we will be discussing ways to profit on the long and short side, particularly from those companies beating or missing earnings expectations. If you are interested in attending this event just click here to register.