Editor's Note: This article was originally published in John Murphy's Market Message on Thursday, March 15th at 12:34pm ET
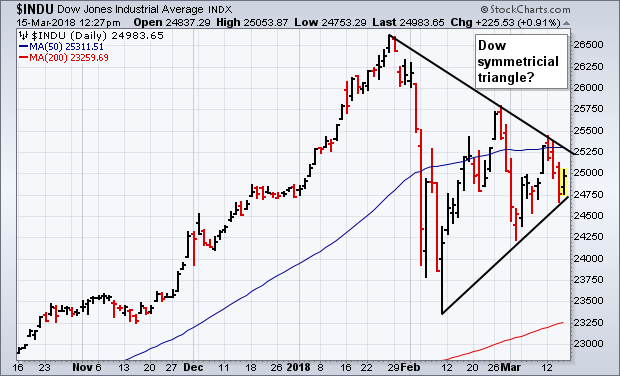
The two converging trendlines in the chart below show the Dow Industrials forming a potential "symmetrical triangle" (which has one trendline falling and the other rising). The falling trendline on top is drawn over its January/February peaks. The rising trendline is drawn under its February/March lows. This is also a continuation pattern which favors an eventual upside breakout. The key to the resolution of the pattern is which of the two trendlines is broken first. A break of the lower line would be negative, while a break of the upper line would be positive. Technical odds favor the upside which would also put the Dow decisively above it March high and 50-day average. A Dow Industrial upside breakout would be more bullish if it's accompanied by a similar upside breakout by the Dow Transports.