With most of the large caps finished reporting, it's a good time to take a look and see what is working. Over the last two weeks, Health Care, Utilities, Financials and Real Estate have outperformed the big growth sectors of Communications and Technology.
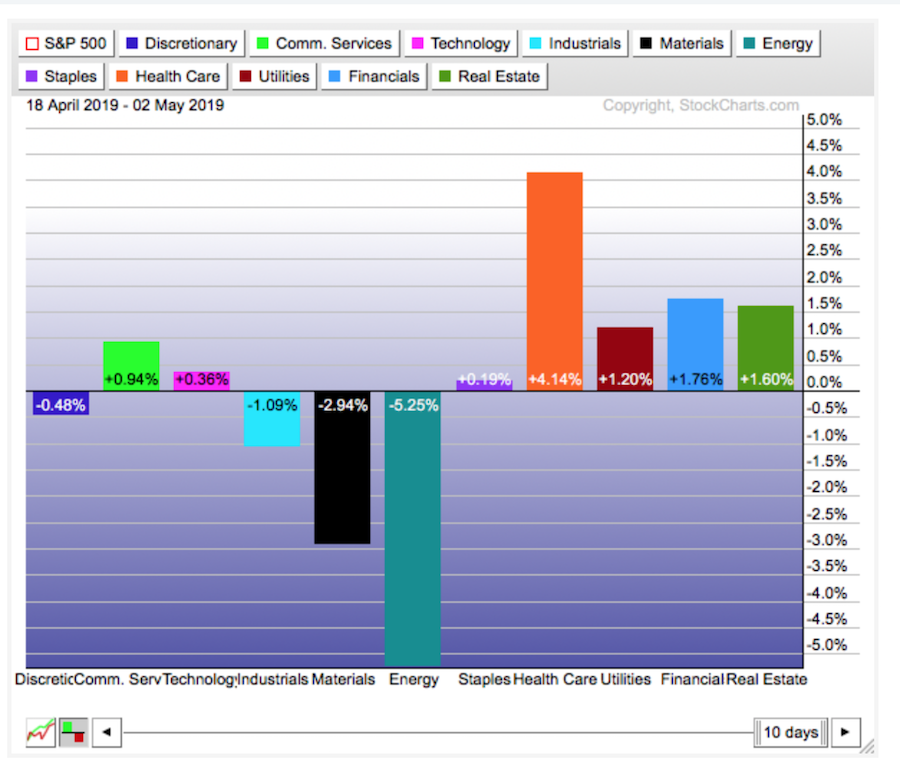 While that can happen from time to time, it surprises me that it is happening just as Apple announces a $75 Billion buyback, Facebook and Microsoft both posted great numbers and Amazon makes a run at $2000.
More concerning is the fact that these fabulous earnings are struggling to pull the broader market up.
Looking at the RRG Chart, it is very clear that the tech stocks have been doing the heavy lifting to push this market to new highs. Even though both Apple and Microsoft are in the $INDU, that group is underperforming the all world index (AWCI).
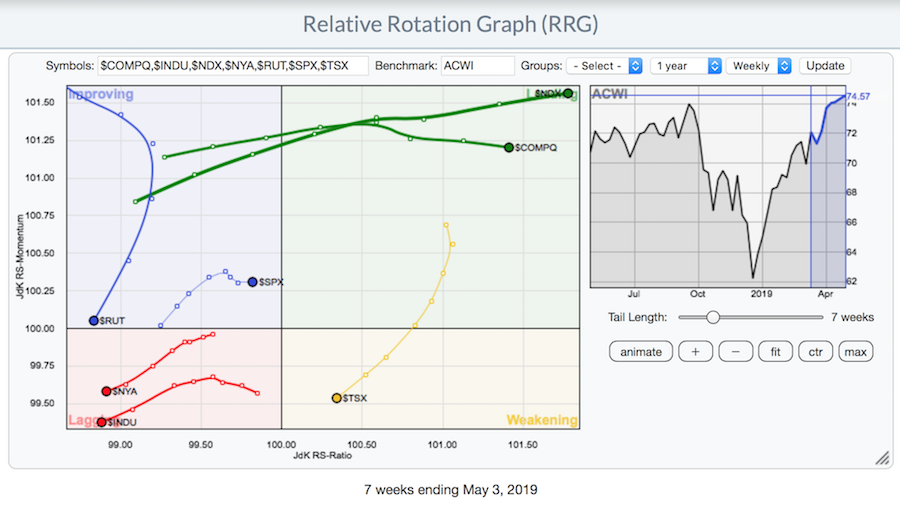 Tech is still driving the macro picture, as shown by the $COMPQ and $NDX being pinned in the top right corner of the RRG. If the short-term rotation to defensives continues, I would keep an eye out for rollovers in the big-name stocks. Seeing the $NYA in the bottom corner is not comforting.
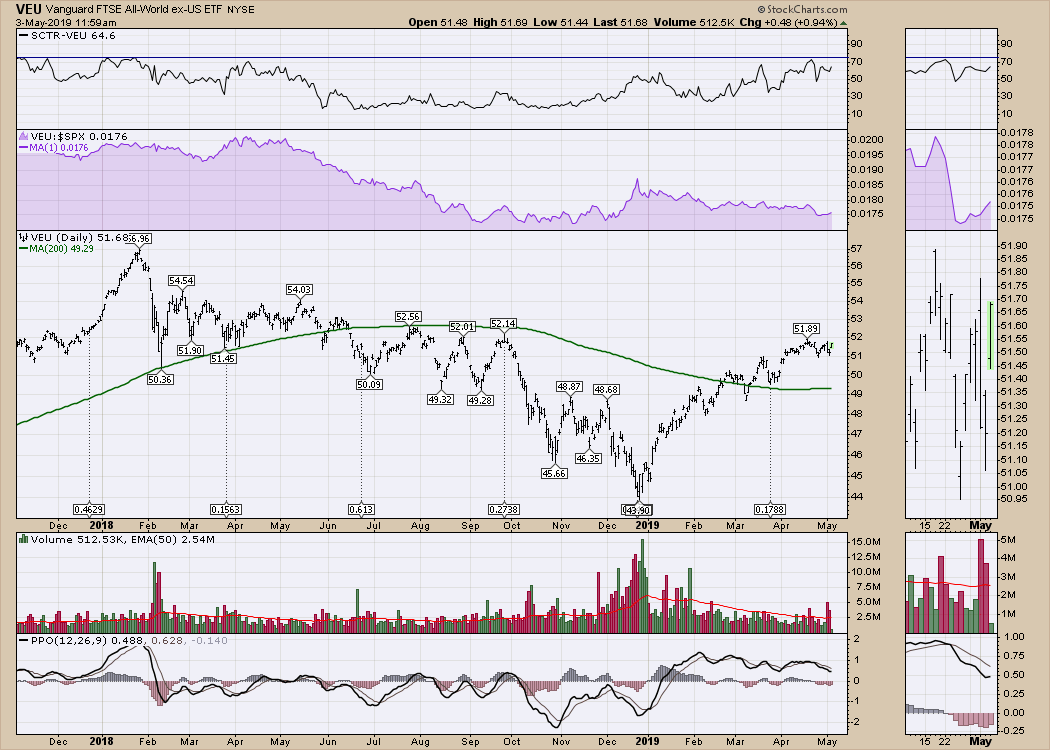
The real issue is whether global growth can start to accelerate - the next chart says "not yet." The rest of world ETF (VEU) is particularly interesting at this level, gently nudging to try and take out the September 2018 level. It has spent 6 weeks going nowhere, so we'll see if this can start to improve.
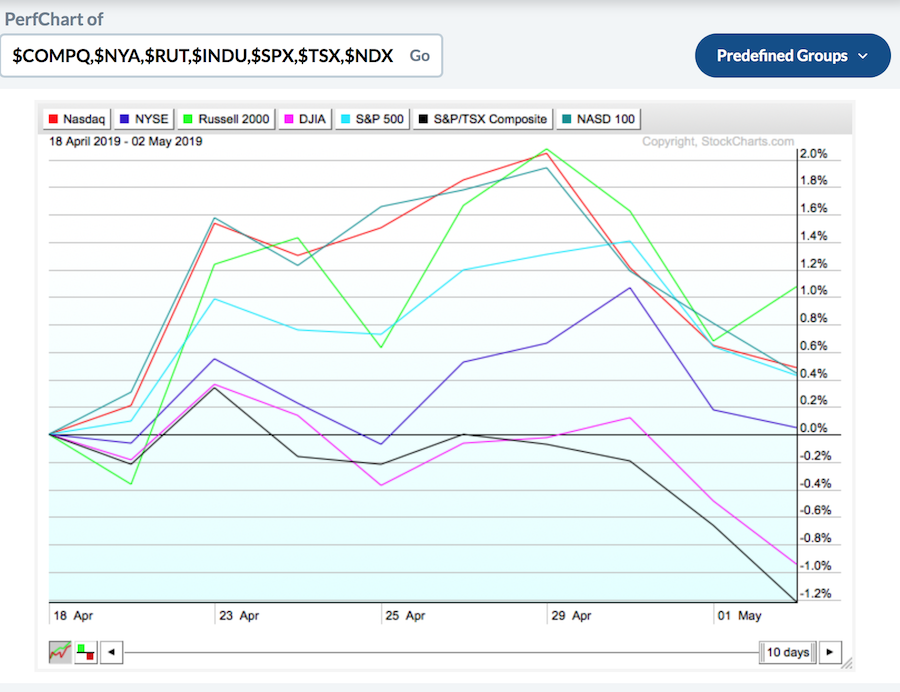
 Currently, the net new highs and advance/decline data suggest that the US market has enough strength to make higher highs. Meanwhile, the Canadian market is struggling. US investors can take advantage of being in the strongest market in the world by watching how related markets start to fail. Currently, Canada looks very weak. It continues to look like the bulls are in charge, but the defensive players are starting to take up some of the ice.
I have a lot of information on video that can be found on the StockCharts YouTube channel. The most recent edition of Market Buzz discusses the Canadian market weakness, as well as how to sort through the Nasdaq 100 using different indicators.
Good trading,
Greg Schnell, CMT, MFTA
Senior Technical Analyst, StockCharts.com
Author, Stock Charts For Dummies
Want to stay on top of the market's latest intermarket signals?
– Follow @SchnellInvestor on Twitter
– Connect with Greg on LinkedIn
– Subscribe to The Canadian Technician
