Editor's Note: This article was originally published in John Murphy's Market Message on Friday, November 22nd at 12:01pm ET.
Last Friday's message wrote about healthcare stocks going from one of the market's weakest sectors to one of the strongest. During the first eleven months of the year, healthcare was the market's second weakest sector (with only energy doing worse). Over the last month, healthcare moved up into second place (just behind technology). Over the last week, healthcare moved into first place; and is hitting a new record again today. Its chart reflects that improvement.
The daily bars in Chart 1 show the Health Care Sector SPDR (XLV) recently rising above its 2018 and 2019 highs to achieve a major bullish breakout. The solid gray area shows the recent improvement in its relative performance. After declining for most of the last year, the XLV/SPX ratio turned up during October and is now trading at the highest level in five months. As last Friday's message also pointed out, healthcare still remains one of the market's cheapest sectors. And one of its best values.
All of the subgroups within the XLV have gained ground over the last month. The three strongest are shown below. Chart 2 shows the Dow Jones Health Care Providers Index rising to the highest level in a year. Chart 3 shows the Dow Jones Medical Supplies Index nearing a test of its July peak. A close above that summer high would put the group at the highest level in a year as well. Chart 4 shows the Dow Jones Biotechnology Index already at a new 52-week high. All three appear to be in healthy uptrends. There appears to be a fourth group that may just be getting started.
Chart 1
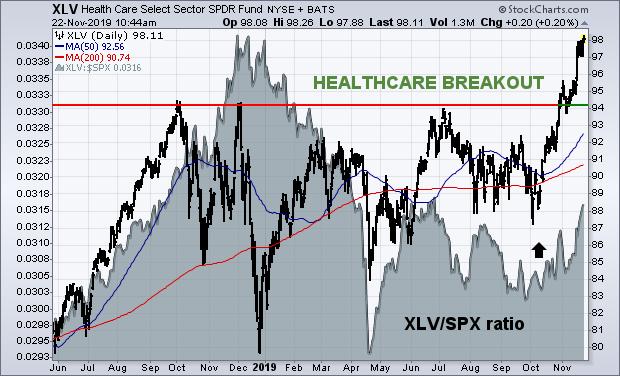
Chart 2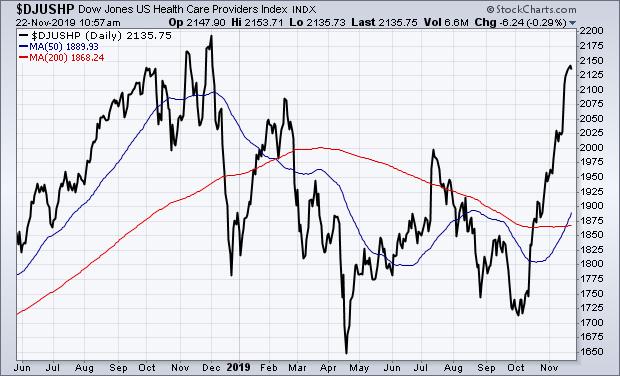
Chart 3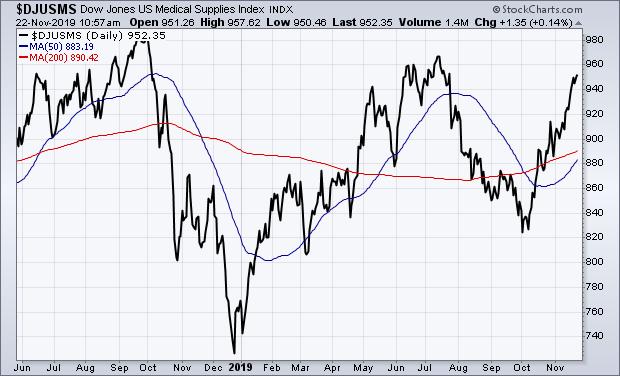
Chart 4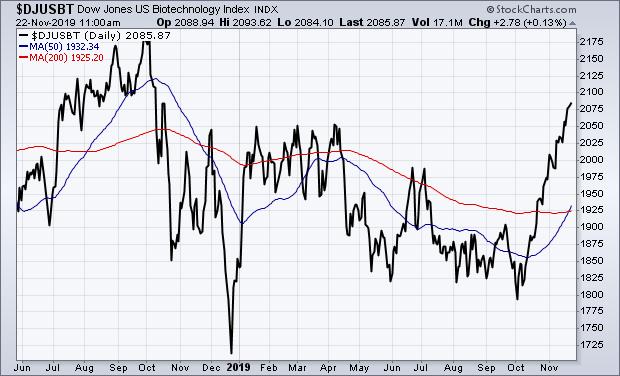
Click here to read the full article in John Murphy's Market Message.
