When I worked for a large asset management firm, we had a number of fantastic digital displays that allowed us to view stock charts on a massive scale. The size of the screens made the work of identifying trends and inflection points much easier - and also way more fun.
We often joked that, when a stock would be in an extended downtrend and the price reached the bottom of the monitor, the bottom edge of the display was not a legitimate support level. To phrase it as one of my early mentors once said, "Never confuse the bottom of the page with support!".
Novice technical analysts will often get excited when a stock price is down, with the hope that they can identify "the bottom" and anticipate an inflection point before it happens. As exciting as that sounds, actually identifying a market bottom as it's happening is incredibly difficult. Doing it once is coincidence. Doing it consistently across markets and cycles is downright impossible. This is why most long-term technical analysts (as well as quantitative models and hedge funds) employ more of a trend-following or "momentum" approach, with the goal of confirming when a new trend is in place and sticking with existing trends until signals start to suggest otherwise.
This brings me to the chart of Cisco Systems (CSCO), which remained in the mid-$40 range this week. That is down over 20% from its peak of just below $58 back in July.
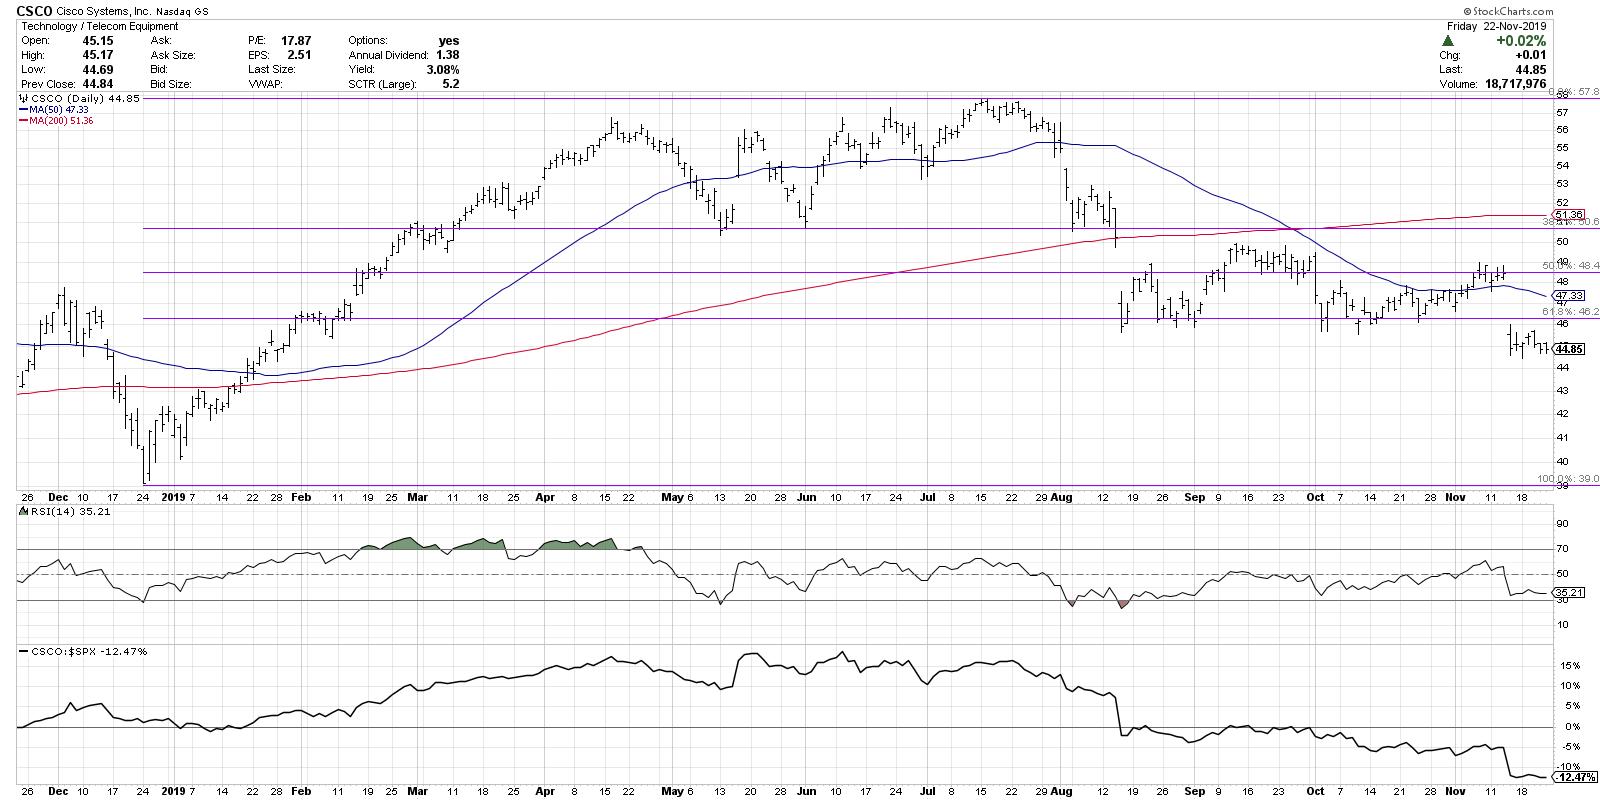
After trading down to its 200-day moving average in August, CSCO gapped down to find support around $46, which lined up perfectly with a 61.8% Fibonacci level based on the 2019 rally.
The next three months saw Cisco bounce repeatedly off this key support level, with every new retest serving to solidify the importance of this line in the sand.
CSCO finally broke down through that resistance last week, with another gap down to around $44.50. This week saw further distribution, with most days seeing a close lower than the opening price.
At this point, we have a stock forming a consistent pattern of lower lows and lower highs - that is, a downtrend. The relative strength made another new low in recent weeks and continues to slope downward. The RSI is not yet oversold, suggesting there is plenty of potential for further downside.
To summarize, Cisco is in a downtrend with no real technical indication of anything changing soon. And to summarize that summarization, don't confuse the bottom of the page with support.
RR#6,
Dave
David Keller, CMT
Chief Market Strategist
StockCharts.com
David Keller, CMT is Chief Market Strategist at StockCharts.com, where he helps investors minimize behavioral biases through technical analysis. He is also President and Chief Strategist at Sierra Alpha Research LLC, a boutique investment research firm focused on managing risk through market awareness. He is a Past President of the Chartered Market Technician (CMT) Association and most recently served as a Subject Matter Expert for Behavioral Finance. David was formerly a Managing Director of Research at Fidelity Investments in Boston as well as a technical analysis specialist for Bloomberg in New York. You can follow his thinking at MarketMisbehavior.com, where he explores the relationship between behavioral psychology and the financial markets.
Disclaimer: This blog is for educational purposes only and should not be construed as financial advice. The ideas and strategies should never be used without first assessing your own personal and financial situation, or without consulting a financial professional.
The author does not have a position in mentioned securities at the time of publication. Any opinions expressed herein are solely those of the author, and do not in any way represent the views or opinions of any other person or entity.
