I recently (20150917) pointed to the $DJUSAU (Dow Jones US Autos) chart in my webinar as a chart trying to break out. I was not suggesting a cloud of black smoke would be blowing over the industry with the VW emissions crisis. What was I thinking? Well, here is the chart. Recently, the index started to surge above the 50 DMA but still had not gotten above the 200 DMA. The MACD had not started to make a higher low, but I suggested that it could be an industry group to watch if this could start to break above some resistance. Well, the chart shows exactly 5 days ago was the high of the move and was the same day as the webinar 20150917. Here is the link and you can slide to the 59:00 minute mark. Commodity Countdown 20150917.
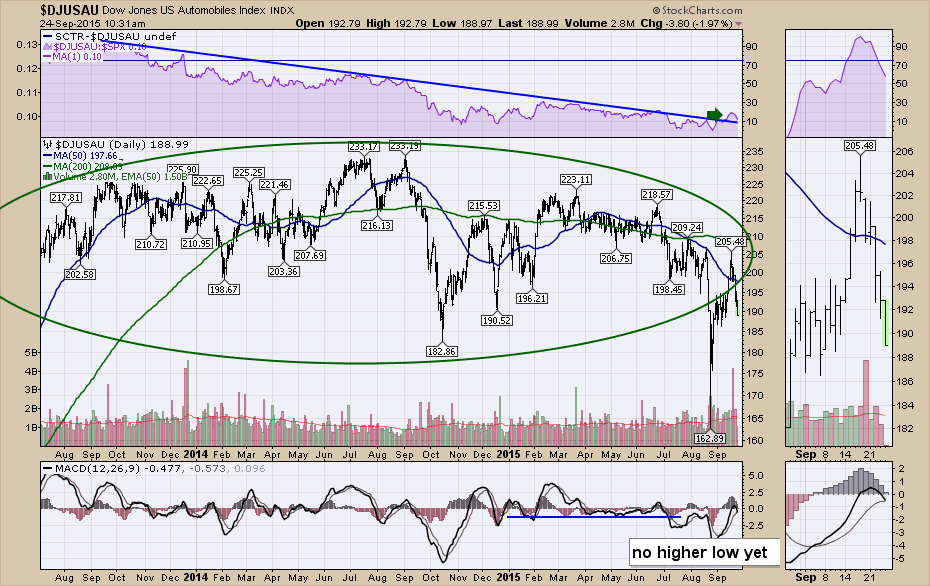
Now the whole thing is called into question obviously. The chart had not broken out yet and is a good example of how the volatility has increased recently.
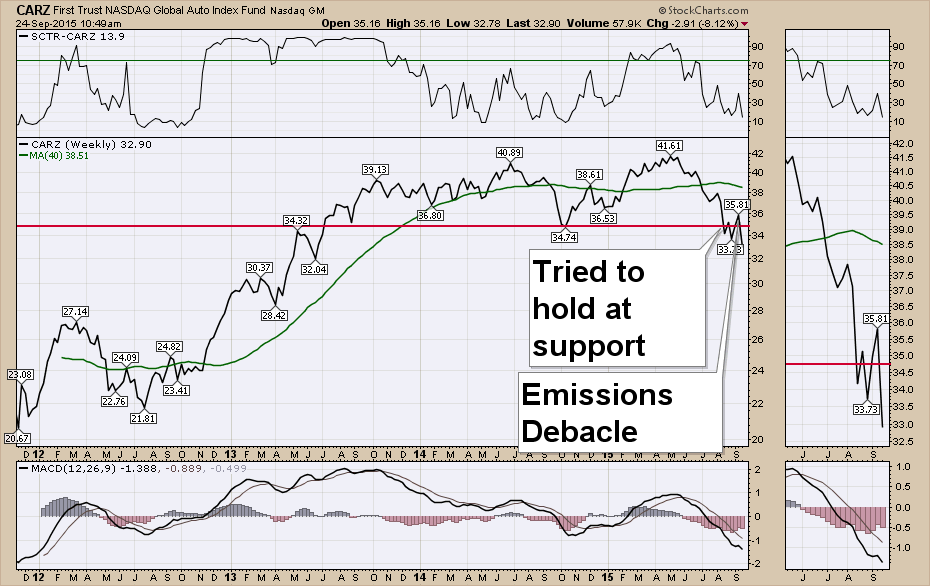
Let's look at some charts to analyze the situation for the industry in general. Here is the CARZ ETF. The ETF made its highs approximately the month before the US market topped. I'll be speaking about this today on the Commodities Countdown 20170924 webinar.
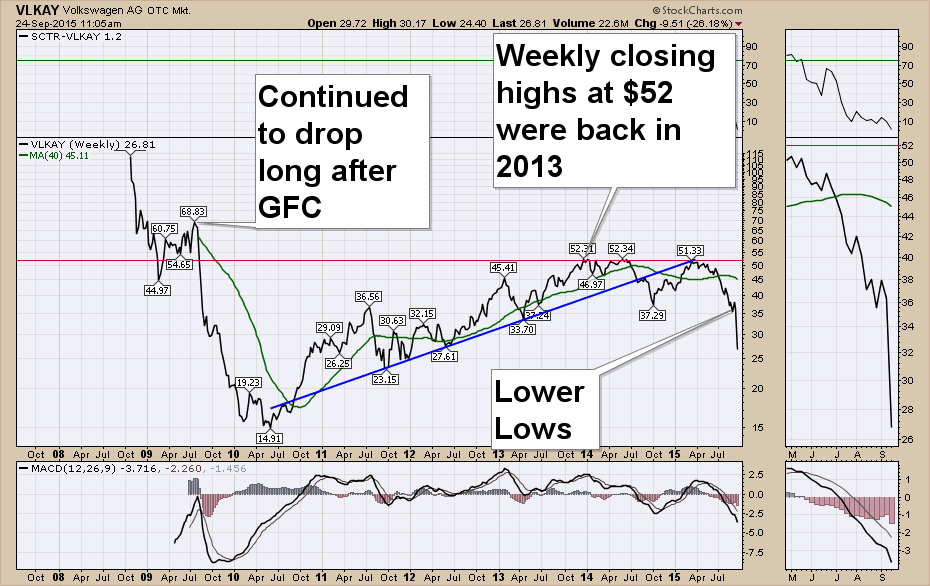
Here is the troubled chart of Volkswagen. VLKAY. The stock topped out in 2013, broke the trend line in 2014, back tested it in 2015 and has now officially broken down.
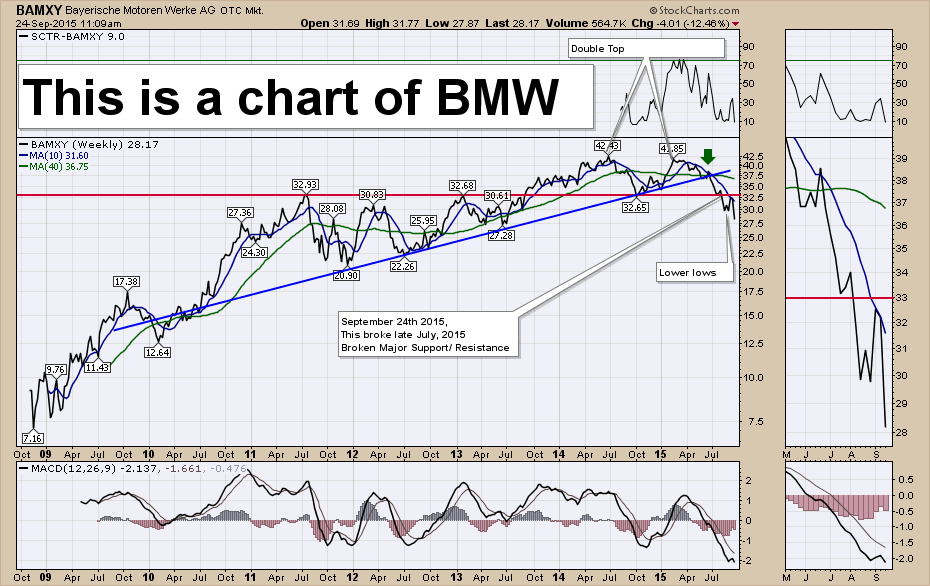
BMW (BAMXY) registered a double top in 2015. The 10 WMA crossed below the 40 WMA right on the trend line break. All good clues to leave the party. The unsuccessful test to hold the horizontal line at $32.93 was important. But more so was the back test from below that failed to hold.
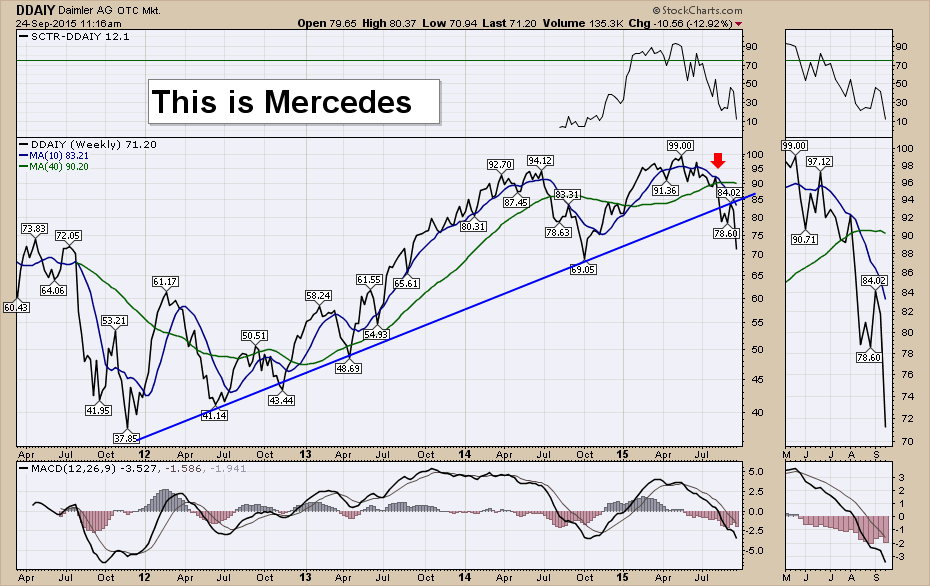
Mercedes (DDAIY) has not been implicated to my knowledge, but the chart was broken months ago with the fail at the 40 WMA, the bear cross and more recently the trend line snap.
Let's look at a couple of Japanese auto makers.
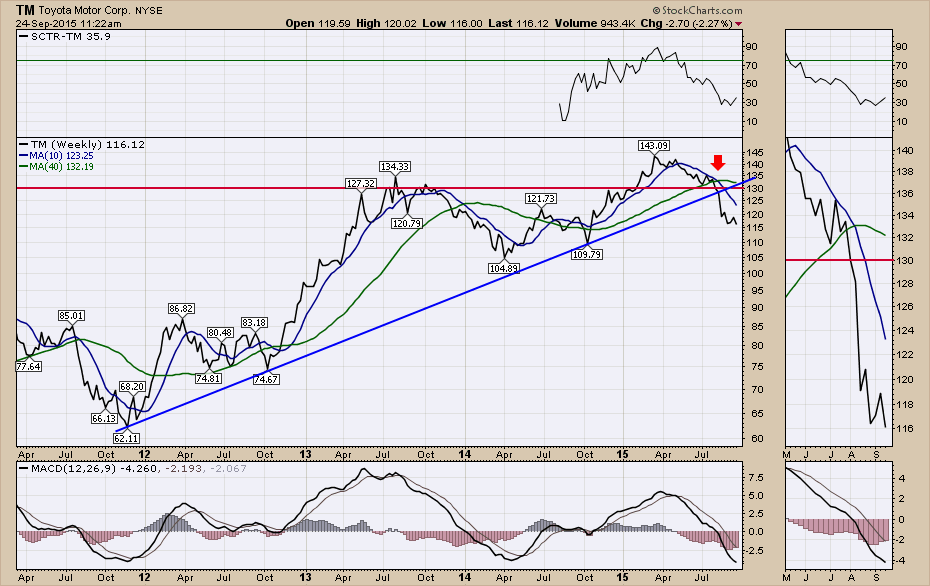
Toyota Motors (TM) has been soaring, mostly on the back of a weakening Yen. But it broke down below the 40 WMA in July, had the 10/40 cross and the trend line break. That doesn't sound bullish.
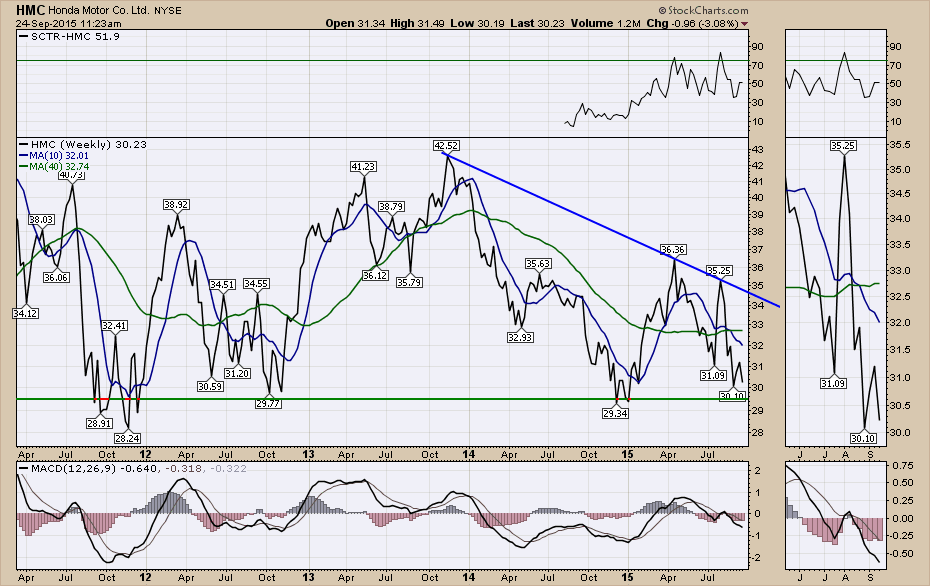
Here is the Honda Motor Company (HMC) chart and it is hard to find a nice entry other than trying to buy at support near $29. That would be a tough buy for me this week, seeing all the peers breaking support in July.
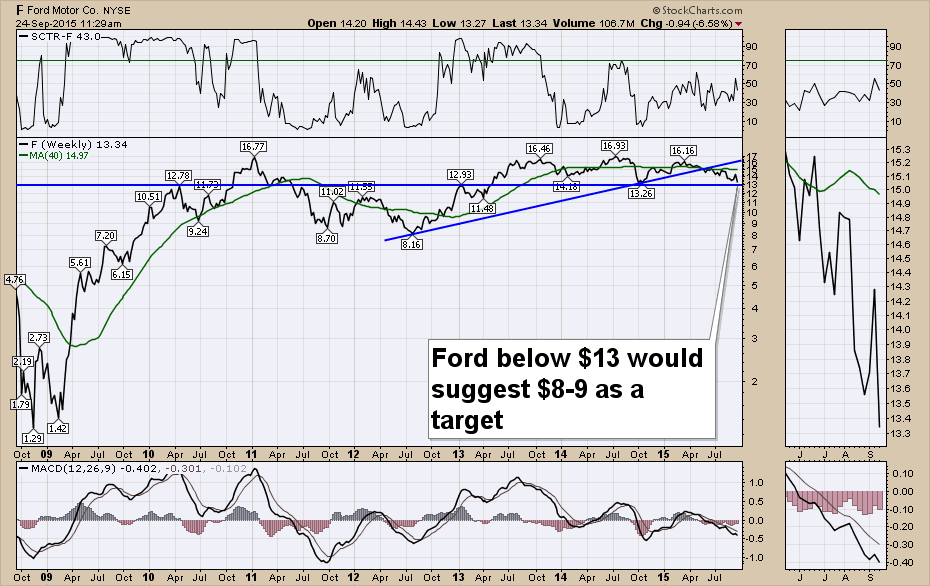
Let's move to some American auto makers. Ford (F) has broken the uptrend. $17 looks like a long-term ceiling on the stock. $13 is support resistance. A fail here and it could test the 2011-2012 lows based on the chart patterns.
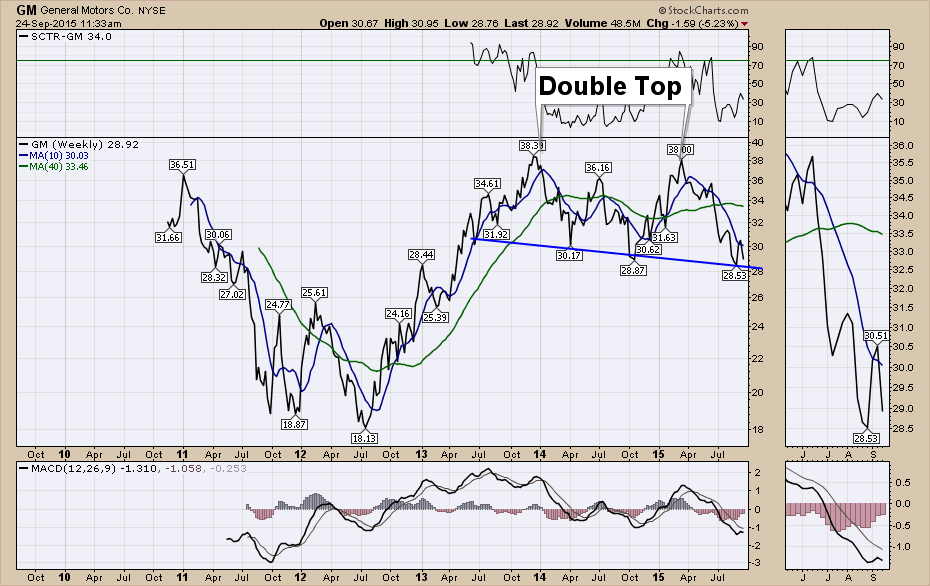
Lastly, let's look at General Motors (GM). This chart made an initial high late December 2013 and tested that high this year. $38 looks like a major hurdle now for GM and the down sloping support line suggest this could drop quickly. Horizontal support / resistance should be around $24-$25 where it was back in the centre of the double bottom. That is only another 10 % down from here.
We have one more stock to cover. It's not emissions related. It is just the king of the group right now. Loaded with Las Vegas size government grants for automobile plants, the stock has been on a run. Tesla (TSLA).
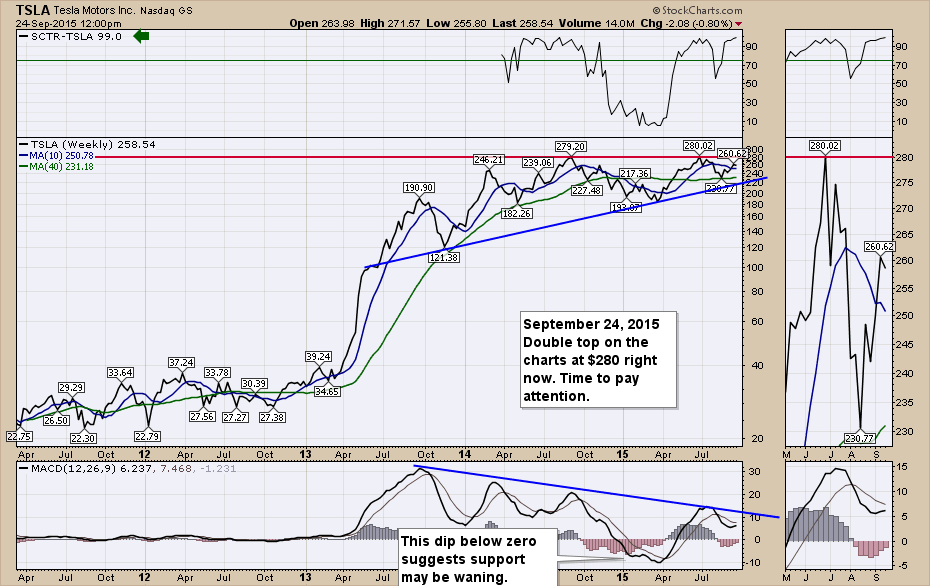
So the car industry worldwide broke down in July, tried to bounce last week and is falling away from under major support / resistance levels this week. That is not bullish. Tesla (TSLA) is holding up well but it is very rare for a single company to not get sucked into a down draft with the rest of the industry. The stock market could bounce over the next few weeks and give Tesla a chance to retest the highs around 280. That will be an immensely important test.
The bottom line for me. Most of these charts, not just Volkswagen, were broken in July. That was 2 months ago. However, the chart of Volkswagen showed some severe resistance and all three German car manufacturers had double tops on the 2014 and 2015 peaks.
I'll have lots of trend lines to examine in today's Commodities Countdown Webinar. Hopefully you can join me. Click to register here. Commodities Countdown 20150924.
Good trading,
Greg Schnell, CMT
