Crude ($WTIC) rallied off the Friday lows with the equities markets. Friday was also a test of the early morning lows back on September 24th and we have built a floor in September. Here is the 3-month chart.
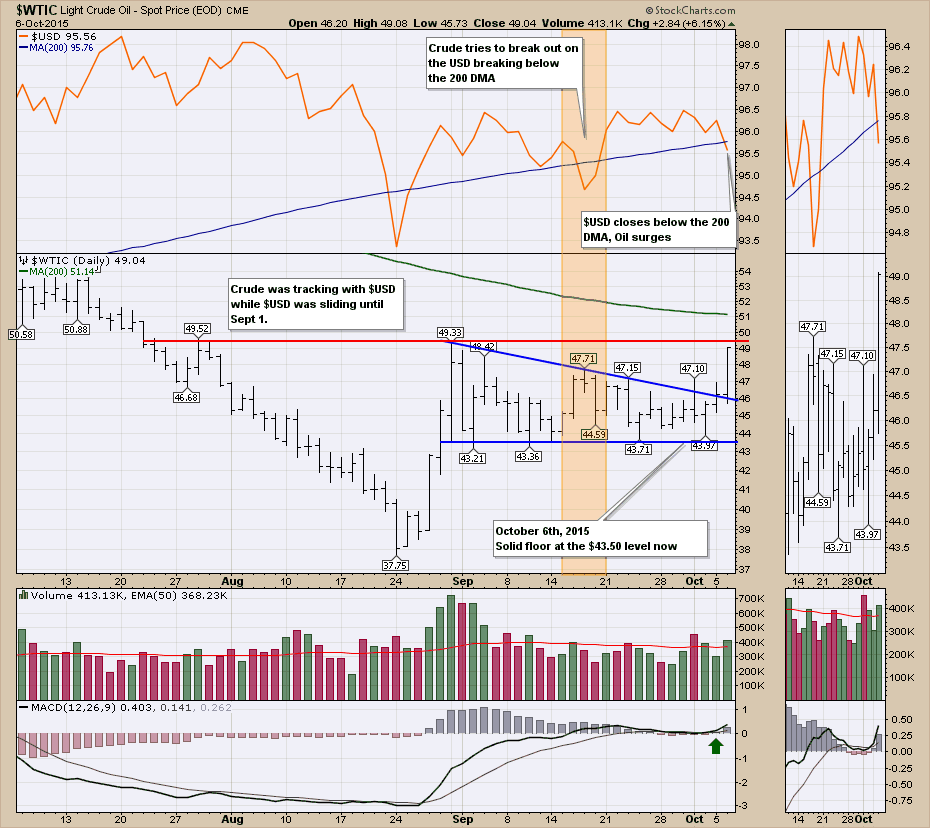
So the next short-term level of resistance is $49.33 which is the top of the Monday, August 31st bar. With only a few intraday tests below that bar that held up, we are now looking to see if we can break out of this August 31st candle range between $43.60 and $49.33.
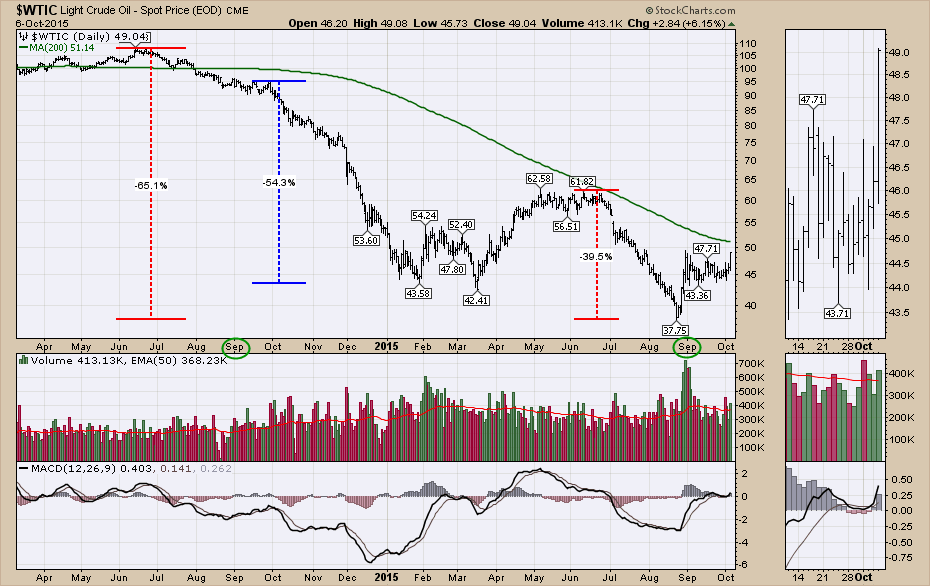
It is also a good time to look at the bigger picture. We can see that the slides in crude have been large. From the June 2014 highs to the September 2015 lows has been a 65% drop. The drop from June 2015 to September 2015 was almost 40%.
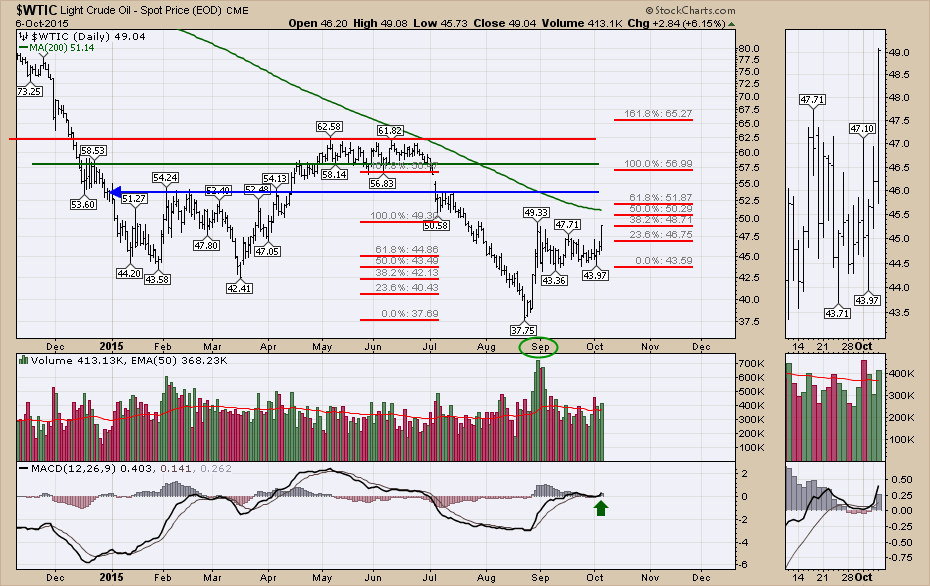
Let's look at some other levels on the chart.
- $49.33 is the top of the resistance level.
- If we can break above the $49.33, the 200 DMA sits at 51.14. It has not even been touched since the drop in 2014, so it would be normal to expect resistance there.
- A move up from the most recent low of 61.8% of the August thrust (August 24 to 31) = $51.87.
- The closing price of 2014 was $53.71 shown with the blue line. This was formidable resistance for the first 100 days of 2015.
- Using some Fibonacci extensions, the 161.8% level is $56.47.
- This looks like an impulse move in the wave pattern higher. It is also shooting up to 1-month resistance so this is very important.
- The ABCD measured move is $56.99.
Lastly, a look at the long term picture.
- Long term support seems solid at $35.
- The $50-$51 level was a centre support/resistance level after the initial breakout above $35 in 2004.
- The bounce off $50 in 2005 and the bounce off $51.21 in 2007 marked another major low before the thrust to the final, major 2008 high.
- Price bounced up in late 2008 and stalled near $50. On the bounce back up in the spring of 2009, it oscillated around $50.
- Around $49-$50 was also a support/resistance level in early 2015, after the initial momentum low was put in. This oscillation around $49 - $50 in the spring of 2015 is easier to see on the chart above.
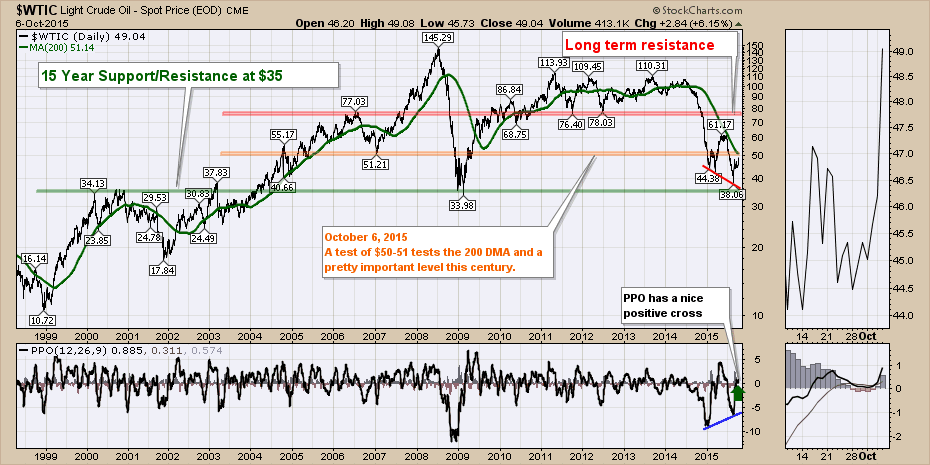
All that to say, there is a huge amount of resistance immediately above here. Long-term resistance, short-term resistance, the 200 DMA, the 50 % and 61.8% measured moves of the initial thrust off the August lows.
Working in favour of a continued breakout would be more weakness in the $USD.
I will be focused in on the crude oil area in the webinar on Thursday, October 8, 2015. I will cover off the Bullish Percent chart that we have been working from in the webinars. I have some great stock examples that are interesting in the oil and gas sector. We have bear market signals in the overall market, so this is a critical week to study the macro trend. I have so much to cover for the webinar, I hope you can join me. The link to the webinar is always on the What's New section of the home page or the What's New section of the members page. This link is for the Commodities Countdown 20151008 Webinar registration.
Lastly, you can subscribe to get notified whenever there is a new blog article on this page. Click on the Yes button below. As I am still building the content up, so please join me if you enjoyed this article.
I covered off the commodities last week on the webinar and focused in on the $USD. The link to that webinar recording is here. Commodities Countdown 20151001. There is a lot of information in that webinar about the signals making for a bear market in my work. As it would be boring to cover off the same angles every week, I will put together some other charts regarding what we would need to see to confirm the bear top.
Good trading,
Greg Schnell, CMT
@schnellinvestor on Twitter
