Week-after-week I receive another email from someone who thinks Commodities have bottomed. Based on time cycles, dollar cycles, near previous lows, China getting better, or a myriad of other reasons, the emails keep discussing why this is the perfect time to go long commodities. Value buyers have been trying to buy these for months and years now. I look at my screen of 60-minute charts and oil is down at least 10 days in a row now. Natural gas is at 10-day lows, gold tested 10-day lows this morning. I widen the view and the dollar is at 1-month highs, oil broke to 1-month lows this morning, gold tested 10-day lows this morning, Natural Gas made lower lows which were actually continuing to make new lower, 3-year lows.
While I would love to report commodities have bottomed, I continue to build a list of charts for me to recognize when long-term bottoms will show up on the charts. The charts from the webinar of October 22, 2015, where I suggest that the $CRB does not look like a bottom based on the internal commodities that make up the index, are presented here. This is a link to the webinar. Commodities Countdown 20151022. I have posted these webinar charts today so you can save them into your own chartlists.
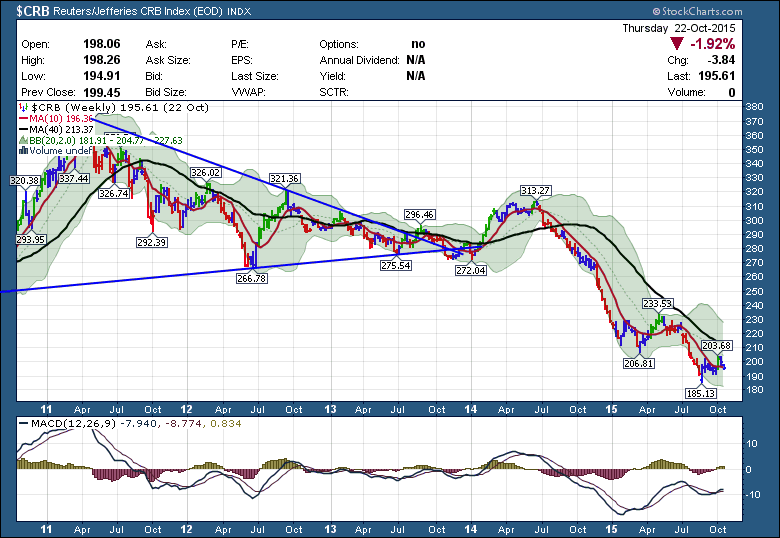
The energy components are the major components of the $CRB. If people don't need as much energy or supply exceeds demand, this will have a tough time bottoming. Just by keeping track of the number of commodities below the 40 WMA, we can get a good idea of when the $CRB will be starting to climb. On the charts below I have represented 98% of the $CRB. Of those only 2 are above the 40 WMA. That means 88% of the components of the $CRB are residing below the long-term average.
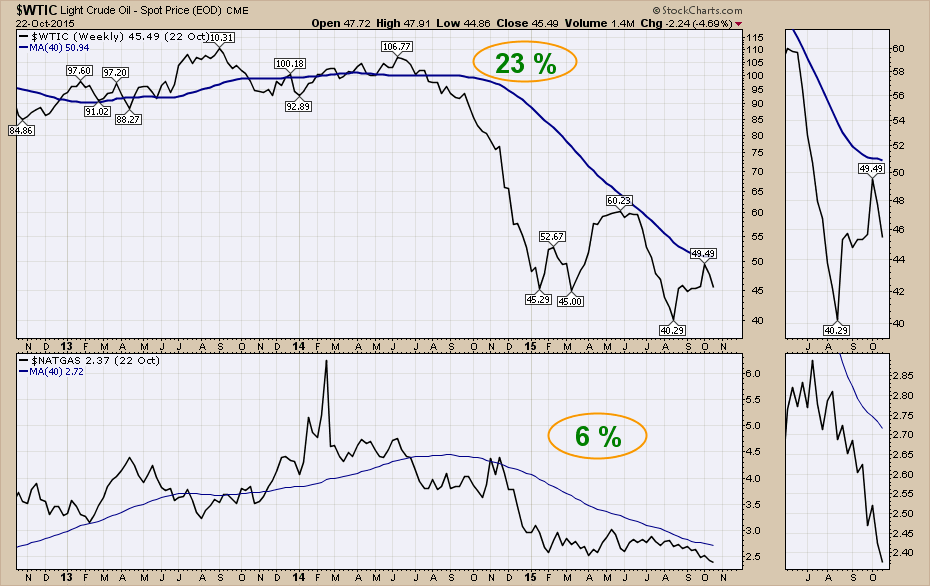
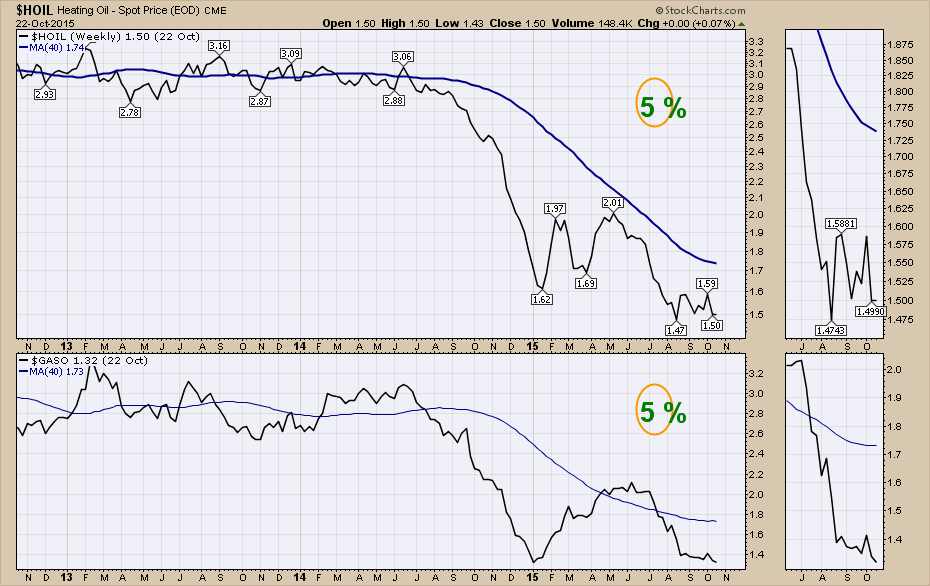
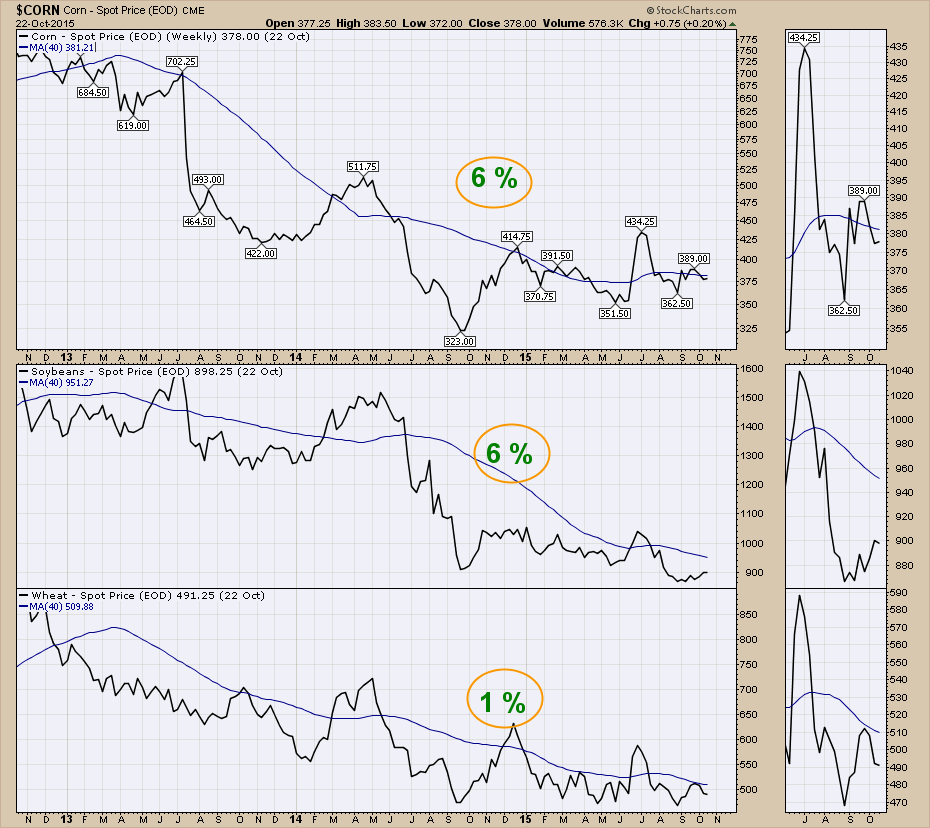
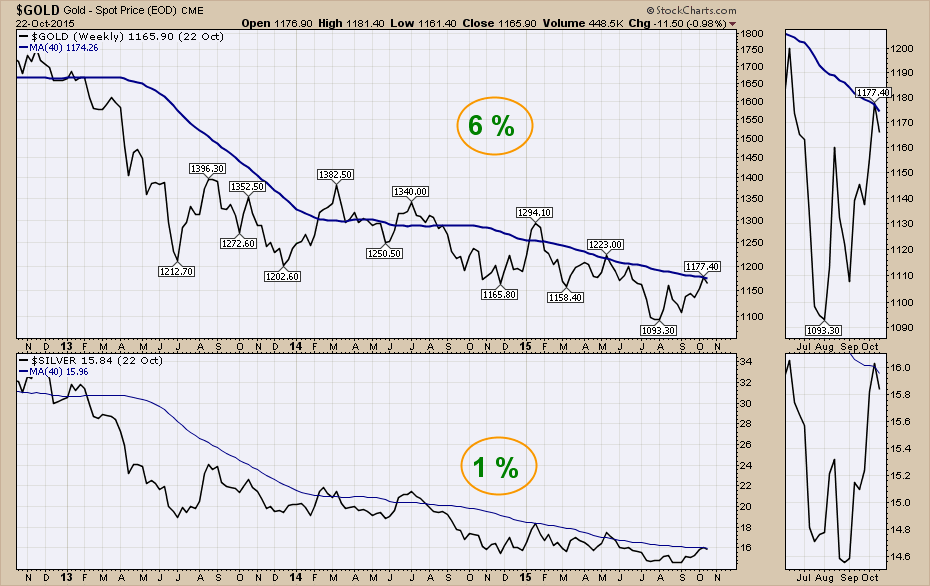
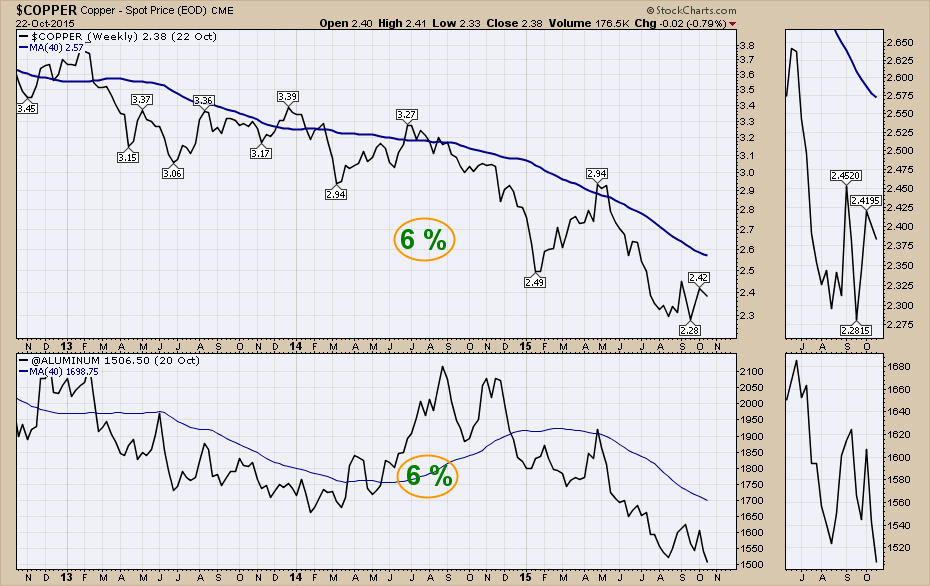
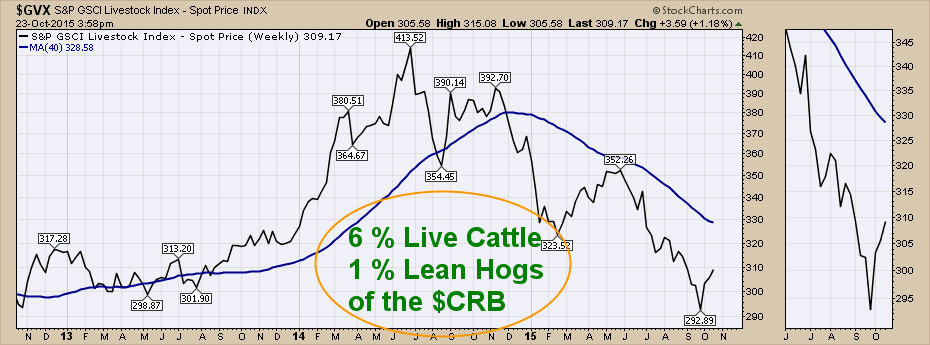
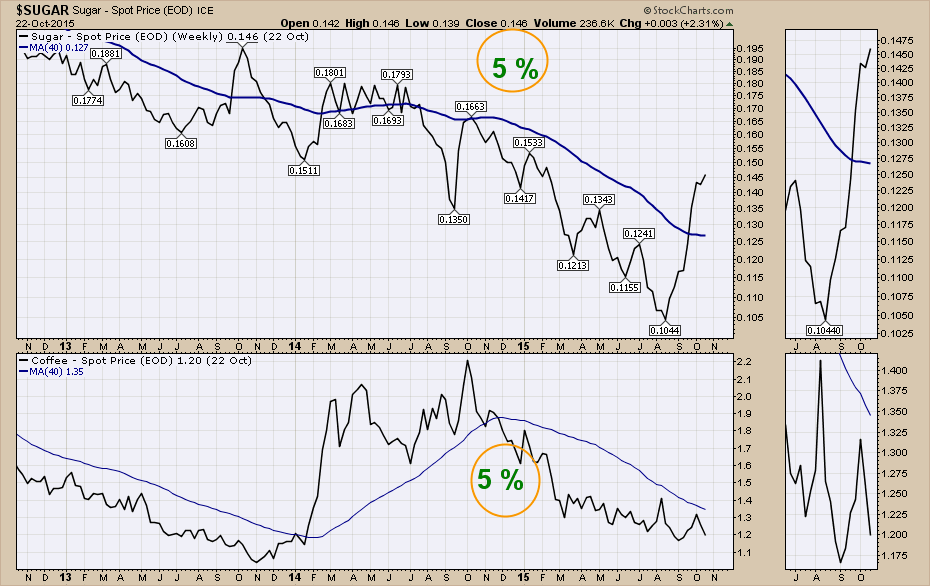
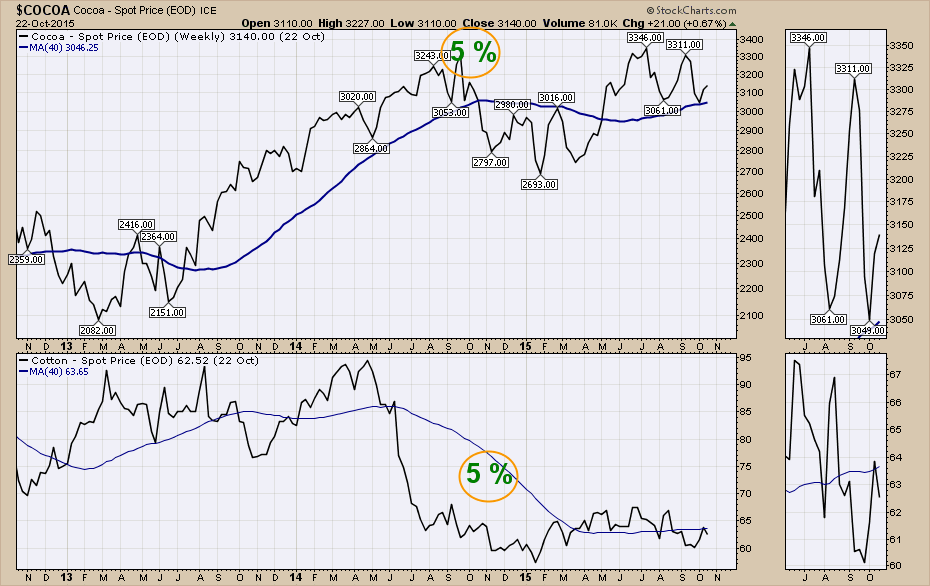
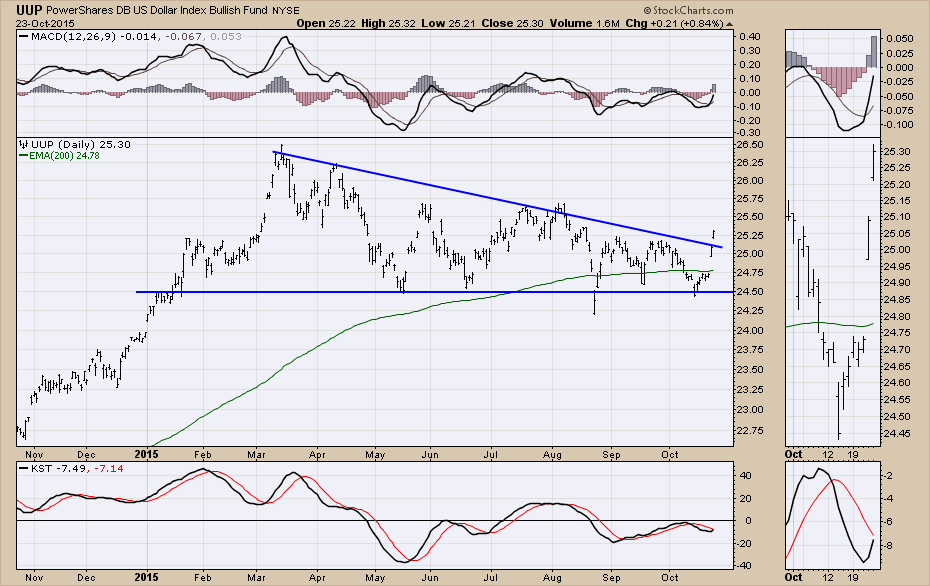
As you can see, at the time of writing this does not look like the bottom based on the fact that so few are turning up here. In order for the $CRB to improve, a lot of commodities have to turn higher to change the direction of the 40 WMA. That has not started to happen. Lastly, the breakout of the UUP representing the $USD on Friday makes the commodities bottoming story even harder to buy.
For more information on the overall picture, I presented my thoughts in the webinar. Commodities Countdown 20151022. We might not catch the exact low, but we'll be ready when it does start to rotate.
Good trading and have a great weekend,
Greg Schnell, CMT
