 After I did the research for my book “Candlestick Charting Explained,” originally called “Candlepower” in 1991, I realized that many were looking at patterns incorrectly. This included candle patterns and classical chart patterns. This was first noticed in a few academic papers attempting to show that these patterns did not have any predictive ability. Let me show you an example of what I am talking about. Consider the following chart:
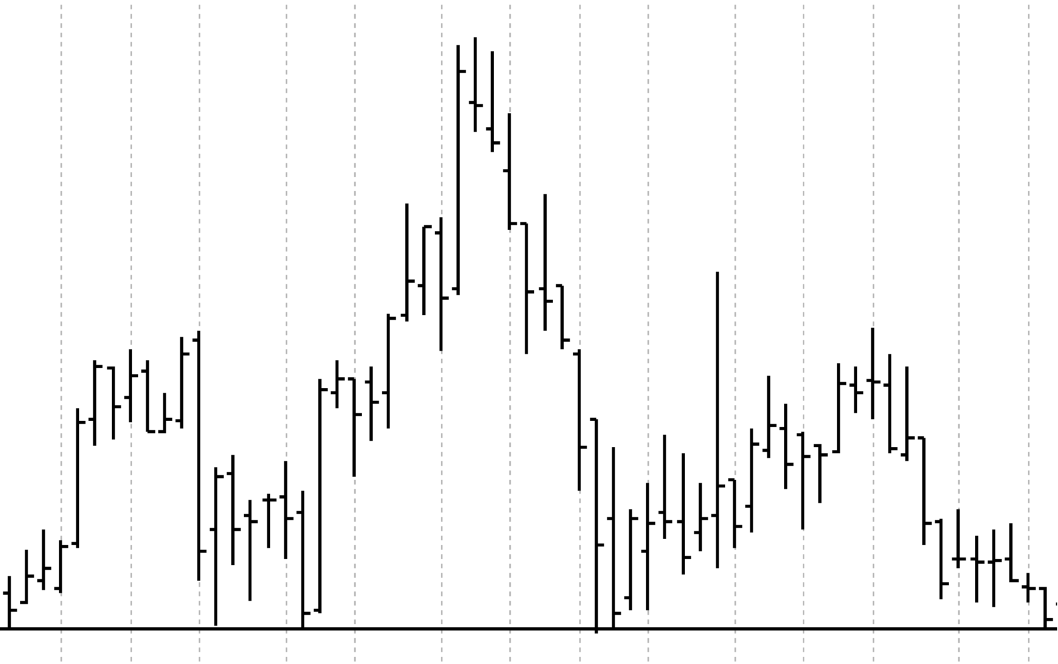
Chart A
If I asked you what the data in Chart A looked like to you, what would you say? Many will say that it is a Head and Shoulders pattern. I would then ask what is a Head and Shoulders pattern. Most (hopefully) will respond that it is a reversal pattern. I would then ask what it is reversing. This is the catch. A reversal pattern has to reverse something and that something is the preceding price trend. So, let me ask again; what do you see in Chart A? The answer should be that you see a series of bars that look like a Head and Shoulders pattern, but since you have no idea about the preceding trend, you do not know for sure. If the preceding trend were up, then it would be a Head and Shoulders top. Now for the Edwards and Magee purists, it could also be a continuation pattern if in a downtrend, but again, you do not know that either since the trend is not presented.
Many, especially academics, will identify classical and candlestick patterns out of context; without any effort to know what the preceding trend is. This is nothing more than sloppy analysis and will yield nothing of value. So let me adamantly state, “Reversal and Continuation Patterns are Reversing or Continuing something, and that something is the preceding Trend.” Further discussion on this would be to cover just exactly what the preceding trend should be doing to make the pattern more effective. Personally, if I were to see a Head and Shoulders Top in an uptrend, I would want the magnitude of the uptrend move to be at least as much as the distance from the head to the neckline in the pattern. In other words, the bigger the pattern (pricewise), the bigger I want the uptrend. If the uptrend is not as large as the head to neckline distance, then I deem the pattern not as effective.
OK, time for a test. See Chart B.
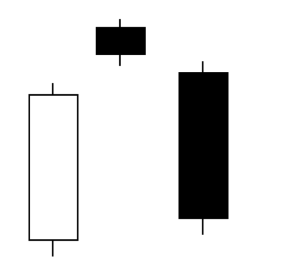
Chart B
Chart B is a Japanese candle pattern. What is this pattern? Most will identify it as an Evening Star pattern – a 3 day pattern. The Evening Star pattern is a bearish reversal pattern. However, you do not know what the preceding trend is and therefore you are only stating that it LOOKS like an Evening Star but not for sure. Once you find that it is in an uptrend, then you would be correct. Chart C below shows that the preceding trend is in fact up. While all of this seems obvious, I too often see analysts/talking heads/experts calling out patterns without regard to the trend. Watch for them, they are misleading. Notice a few times I tried to blame this poor analysis on the academics? In fact I see a lot of it by many technical analysts. I’ll stick to trying to offend only small groups at a time.
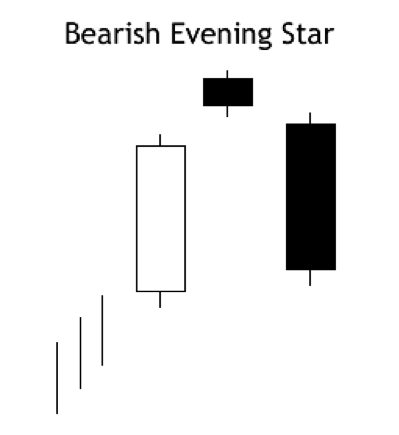
Chart C
In my books, “Candlestick Charting Explained” and “Candlestick Charting Explained Workbook,” I spent a great deal of time and effort in research on the various patterns and identified them ONLY after a trend had been identified. While I have transitioned into Japanese candle patterns, let me mention some things about them in particular that I think many do not realize.
Can you use candle patterns on intraday or weekly data?
Of course you can, however, I don’t recommend it. The Japanese were adamant about the period of time between the close of one day and the open of the next day as being critically important to the psychological evolution of traders in developing the pattern. A lot of decision making can occur from the close of one day to the open of the next. With intraday charts, that time period is just the next data tick, not a lot of time to develop a thought. Weekly data truly voids the concept as the open is Monday’s open, the close is Friday’s close, the high is the high for the week (could occur on any day), and the low is the low for the week (again, it could occur on any day of the week). In fact, the open, high, and low could all occur on Monday, with the close on Friday. The trading activity for the last 4 days of the week would not be seen in a weekly candlestick. However, as with any art form, if it works for you, use it; just please don’t tell me about it.
Why are single-day candle patterns not recommended for trading?
Every day the market sends a message. Here is what I say about single day candlesticks: They are not candle patterns in that they allow you to see the evolution of trader psychology through multiple days like you can with more complex candle patterns. I also say single candlesticks still send a message that should neither be traded, nor ignored.
Why there are more reversal patterns than continuation patterns.
I think it should be obvious that identifying the beginning and end of a trend is more important for trading than the identification of a trend that is continuing. While the continuation patterns should not be ignored, they rarely offer a good trading opportunity, more of a sign of confirmation that the trend is still in place. However, if you did not take a position in the early stage of the trend, the continuation would be a second opportunity to place a trade.
Why there are more bullish reversals than bearish reversals.
If you have ever studied long term charts of the markets or stocks, you can quickly see that when they are developing tops, they are usually long drawn out affairs (distribution), the decision making of selling is more difficult for most investors. However, at bottoms, the emotions are quicker and bottoms tend to be more sharp and defined. This is why there are more bullish reversal patterns than bearish reversal patterns.
As you can see, I have some fairly strong opinions about things and hopefully you will understand that when it comes to technical analysis, strong opinions can be challenged as it is just an art form. Feel free to offer suggestions for future topics in the comment section below.
Thanks!
Greg Morris
Note: You can purchase "Candlestick Charting Explained" in the StockCharts online bookstore.


