 …Or is your measuring stick just too short? If you are starting to feel that the market really only goes up and that the risk of being invested for the long term is small, you probably need a short refresher course on the equity markets. Don’t feel bad, failing to recognize or even remember long term trends and cycles in the market is difficult, especially as the bull move in equities seems to go on and on. Of course the endless, always bullish, babble in the financial media certainly doesn’t help things.
I just saw a perennial bear on television who is all of a sudden bullish, first time ever, I think. This invokes the contrary opinion thought process. I fully agree that doing the opposite of the crowd is better than being part of the herd, but the problem is knowing what the crowd is doing. That is why I have totally dropped sentiment from my analysis because I often think the polling process is somewhat flawed. Plus I have never put sentiment into the actionable information camp; it is just observable information. If anyone thinks sentiment is a good working measure, please make a comment and share with the others.
The current bull move began in early March, 2009, depending upon which market index you are using. In either case we are in the vicinity of the six year point in this up move. How much longer can this trend continue? During the 1990s, we had an uptrend that lasted almost 10 years; of course, its conclusion was somewhat dramatic. Even that most recent dramatic bear market has slipped off most investors’ financial radar – a distant memory, if that. The median for the last 15 bull markets is over 64 months (I’m using the Dow Jones Industrial Average since it has a much longer history), which is a year less than where we are now. Median is a statistical term that isn’t very statistical – it is just a number dividing the upper and lower half of a data sample. Median is usually better than mean when looking at a small data sample.
If you are good at reading large tables of data, just skip this paragraph and look at Table A as this paragraph is the prose version of some of the highlights in Table A. Since Feb, 1885, there have been 15 bear markets including the big one that started in 1929, as defined by a 20% decline on the Dow Industrials. The average duration of these was about 82 months. The severity of the declines went from -20% to -87%, with the last one (2007 – 2009) being down 54%. The median for these declines would be just over 40%. Now here is something that is important, outside of just scaring you with these statistics, the average time it took for the Industrials to recover from the bear market was just over 55 months or almost 6 years; if you took out the huge 1929 bear it would be almost 38 months or a little over 3 years. That’s right, an average of three years to get back up to where the bear market began. So if the average bear market lasts about 26 months and it takes an average of 56 months to get back to where it started, that translates into a little over 5 years of going nowhere and that is not including the 1929 outlier. Don’t even think about including the declining purchasing effects caused by inflation into the equation, it would only worsen the situation. Enough with me reading Table A to you, lots of data in that table, study it. If you come away with thinking you need to avoid bear markets, then you got the message.
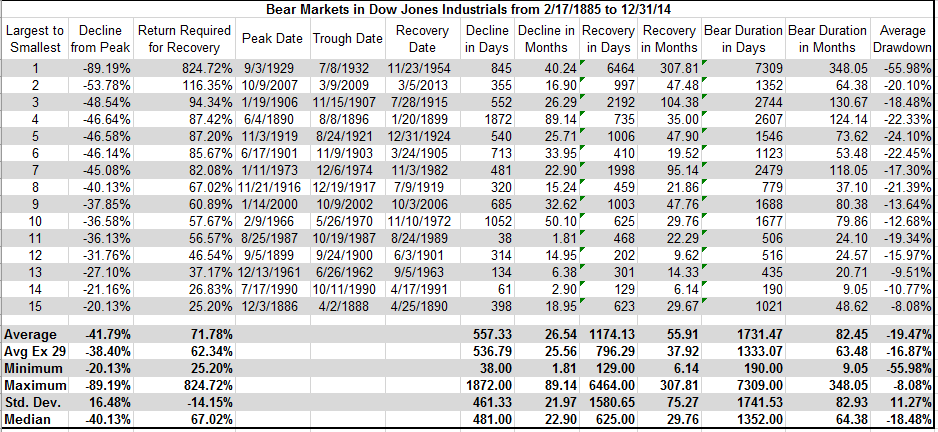
Table A
As always, caution on using averages like I just did is warranted. Using averages like this is only good to keep you in touch with history – they do not predict anything. However, they should make you stop and think. Long term memory is a terrible thing to lose; and the next time just might be longer than average. Some market indices are making new all-time highs; and guess what, all bear markets begin at new all-time highs.
Here is some arithmetic that Wall Street doesn’t like to show you. If you hold onto a stock and it drops 33%, it takes a future return of 50% to get back to even. Another example is, if your holding drops 50%, you have to get a 100% return to break even. 100% return? Are you kidding? Think about it – when was the last time you doubled your money? And breaking even should never be your goal; instead it is just a massaging of one’s ego and never a valid investment strategy. If you catch yourself thinking like that, don’t feel bad, unfortunately it is quite normal. Chart B is a valuable tool to see what is required after a bear market to get back to even. Of course, I’m not talking directly to StockCharts.com members, only to the buy and hold crowd.
Chart B – Courtesy of Doug Short at dshort.com
So why all this scary stuff? I am continuously alert to the fact that the risk of being in the market is always and ever present. That is why I follow a technical model that strives to lessen this risk by putting me into defensive positions when the markets correct. Remember, all bear markets begin with what appears to just be a pullback, then a correction, and when it is down -20% it becomes a bear market. I treat all drawdowns of more than 5-7% as if it is going to be the big one. This uptrend will end at some point, and my active model will signal me accordingly. Sleep well.
Oh, and in anticipation of a comment asking if I'm bearish and think a bear market is about to occur, I would just ask you to read some of the previous articles and learn that I don’t forecast, predict, guess, or hope; I just measure and react. Thanks.
Trade well rested,
Greg Morris
