 Here is the scenario: You believe we are near a top in the market. I won’t bother to discuss what makes you think that, but if you do, then here is a sampling of things to consider. I was originally going to do this in an enumerated list, but decided my rambling would be better.
I know you have stops on all of your holdings, so I won’t spend much time on that. However, just in case you don’t; this would be the time to do so. Personally, I use a moving stop that is a percentage below a previous high price. For example, if my model has me fully invested, that stop is at a point 5% below the highest high price reached in the past 21 days. I keep the stops on the individual holdings and not on the market itself. Chart A shows the percentage decline (drawdown) from previous 21-day high; the black line represents the percentage of decline. For example, in certain situations I use -5% which is shown as the green line in the chart. Whenever the black percentage of decline of a holding drops below the -5% green line I sell. I must add that I would have probably traded up to another holding if this holding was somewhat isolated and many others are not declining as much. Bottom Line: If you are going to spend a great deal of time determining where to put your stop loss level – FOLLOW IT.
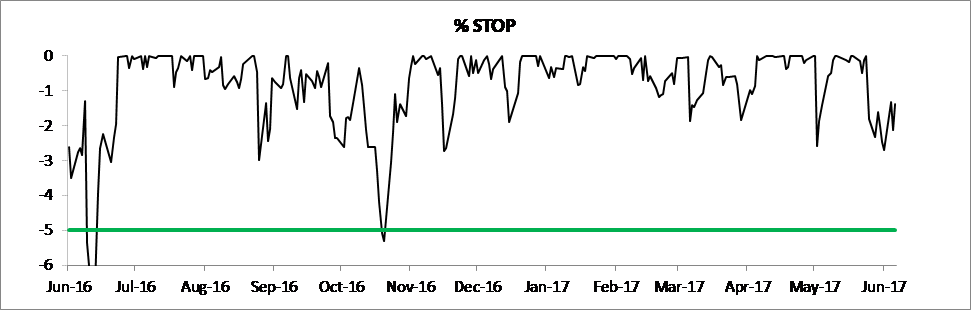 Chart A
Keep in mind that when you are using a moving stop level like I do, it could be painful in a slow shallow decline. Why? The past 21 day’s high price is moving along trailing by 21 days and the price might not ever get 5% below it. You will need a backup stop method to prevent this from happening.
Know what it is that will convince you that the market is about to decline. Hopefully, it isn’t from watching (Cartoon Network) BC. If you are a trend follower then you can ignore the rest of this article. If not a trend follower, then you must have some technical tools that will alert you to sell at some appropriate time. That sounds easy, but it is not. StockCharts.com has a nice trend following stop called Chandelier Exits. These are drastically better than using a moving average as a stop mechanism. You can read about them in ChartSchool here. Chart B is an example using Chandelier Stops.
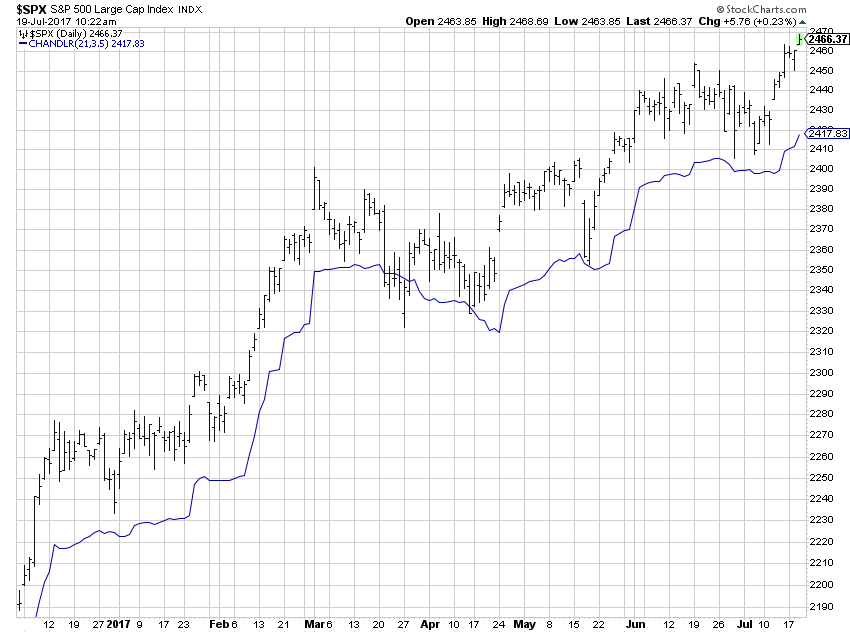 Chart B
Too many investors have the mentality that the market will recover and they are best suited to ride it. Wall Street perpetuates this nonsense because all the while they can show you stocks that are performing better than the market (relatively). Keep in mind that most of them are still declining.
What do you do with your money if you are out of the equity market? This is never easy. Personally, I have absolutely no issue with putting it in a money market fund and receiving the tiny interest payment. At least those are black numbers and not red ones.
If you have your money managed by an advisor, you need to know what his/her actions will be when the market or your portfolio is down more than 10% - 15%. If you continually hear that they only believe it will be short lived, then ask him/her for their records from the 2000-2002 and 2007-2009 bear market. This will tell you what they actually did. If they were not in the business then; good luck.
Anticipating the question as to whether I believe we are near a market top, I'll give you my standard answer. As a trend follower I don't have to worry about it; the trend analysis along with my stops will take me out at the appropriate time. I will state that my trend model is not performing very well right now; but that does not mean a bear market is at hand, it only means the uptrend is interrupted. How's that for being evasive? Certainly more honest than the noise of Wall Street.
Dance with the Trend,
Greg Morris
