 Did you hear about the six-foot tall Texan that drowned while wading across a stream that averaged only 3 feet deep? The “World of Finance” is fraught with misleading information. The use of average is one that needs a discussion.
Figure A shows how easily it is to be confused over what is average. And of course, this time it is intentional. This example should put it in perspective. You cannot relate rates of change linearly. In Figure A, point A is 20 miles from point B. If you drive 60 mph going from point A to point B, but returning from point B to point A, you drive 30 mph. What is his average speed for the time you were on the road?
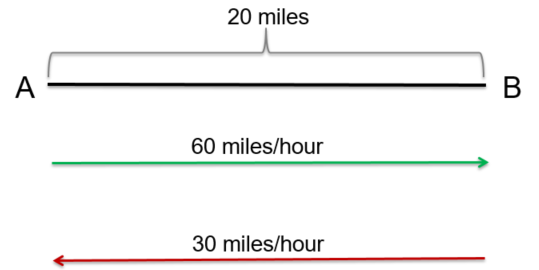 Figure A
What is the average speed for the round trip?
- 35 mph
- 40 mph
- 45 mph
- 50 mph
Many will answer that it is 45 mph ((60mph + 30mph) / 2). However, you cannot average rates of change like you can constants and linear relationships. Distance is rate multiplied by time (d=rt). So, time (t) is distance (d) / rate (r). The first leg from A to B was 20 miles divided by 60 mph or 1/3 of an hour. The second leg from B to A was 20 miles divided by 30 mph or 2/3 of an hour. Adding the two times (1/3 + 2/3 = 1 hour) will mean you traveled for one hour and covered a total distance of 40 miles, which must mean the average speed was 40 mph. Look up harmonic mean if you want more information on this, as it is the correct method to determine central tendency of data when it is in the form of a ratio or rate.
Everything on four legs is a pig. While this is unrelated to investments and finance, it is a story about averages which offers additional support to this topic. Doctors use growth charts (height and weight tables) for a guide on the growth of a child. What folks do not realize is that they were created by actuaries for insurance companies and not doctors. As doctors began to use them the terms overweight, underweight, obese, etc. were created based upon average. So, if your doctor says you are overweight and you need to lose weight, he is also saying you need to lose weight to be average. And from a Wall Street Journal article by Melinda Beck on July 24, 2012… “The wide variations are due in part to rising obesity rates, an increase in premature infants who survive, and a population that is growing more diverse. Yet the official growth charts from the Centers for Disease Control and Prevention still reflect the size distribution of U.S. children in the 1960s, '70s and '80s. The CDC says it doesn't plan to adjust its charts because it doesn't want the ever-more-obese population to become the new norm.” And now you know.
During my last physical examination, I told my doctor about how these charts on height and weight were just large averages created by actuaries for insurance companies and that I did not mind being above average.
Trade Above Average,
Greg Morris
