Periodically I like to run a scan that gathers stocks and ETFs that have a PMO that has been rising for three days and has the 50-EMA above the 200-EMA. Here's what I like about this scan. First, if the 50-EMA is above 200-EMA that implies that the stock is in a long-term "bull market". If the PMO has been rising for 3 days, that means positive momentum has been established. The actual scan is below. I got 42 hits when I ran the scan, so I saved it as a ChartList and clicked through them to find the best chart patterns and indicator configuration.
[type = stock] AND [Daily SMA(20,Daily Volume) > 50000]
AND[today's PMO Line(35,20,10)<today's PMO Signal(35,20,10)]
AND [today's PMO Line(35,20,10) > yesterday's PMO Line(35,20,10)]
AND [yesterday's PMO Line(35,20,10) > 2 days ago PMO Line(35,20,10)]
AND [2 days ago PMO Line(35,20,10) > 3 days ago PMO Line(35,20,10)]
AND [today's ema(50,close) > today's ema(200,close)]
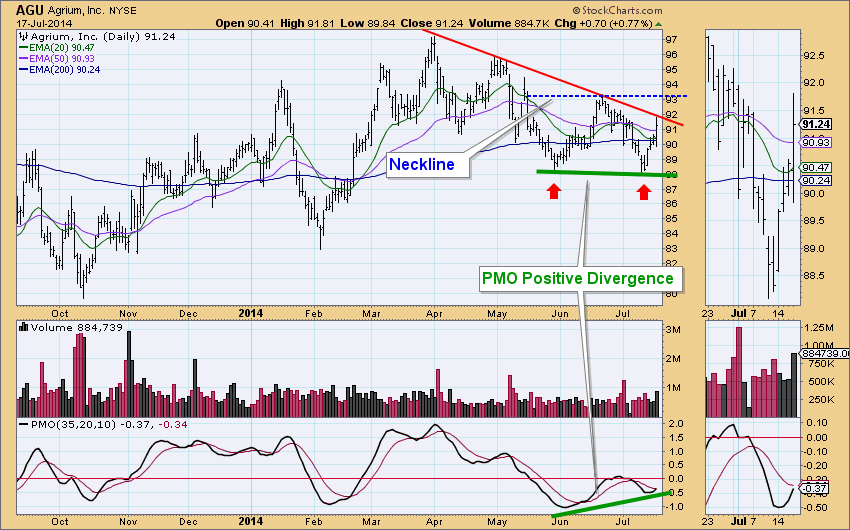
The first chart is AGU. I really liked this chart as there was a positive divergence between price and the PMO, meaning the PMO bottoms are rising and price bottoms are horizontal to slightly falling. The best part is the bullish double-bottom pattern. If price can breakout above overhead resistance and the neckline, the minimum upside target would be around 98 or the March high.
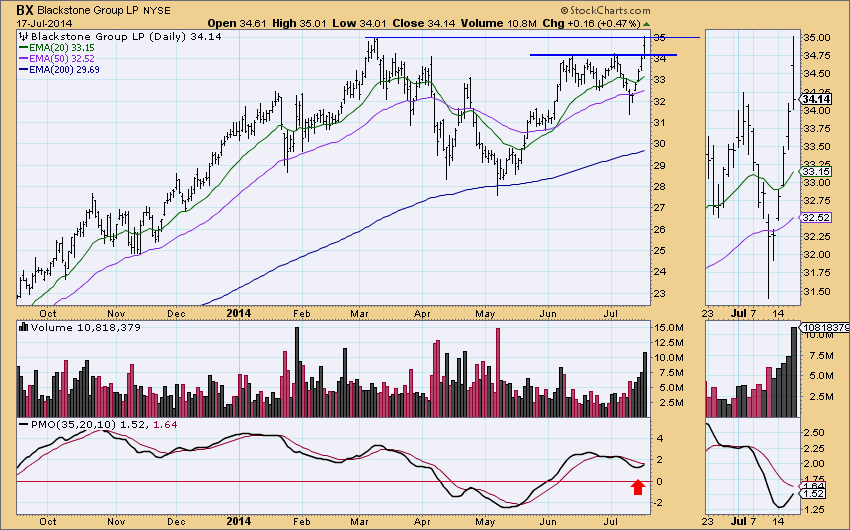
Price has broken above horizontal resistance just above 34 and it peaked slightly above the March high. The PMO should have a positive crossover soon. The long-term and intermediate-term Trend Model signals are both on a BUY because the 20-EMA is above the 50-EMA which is above the 200-EMA.
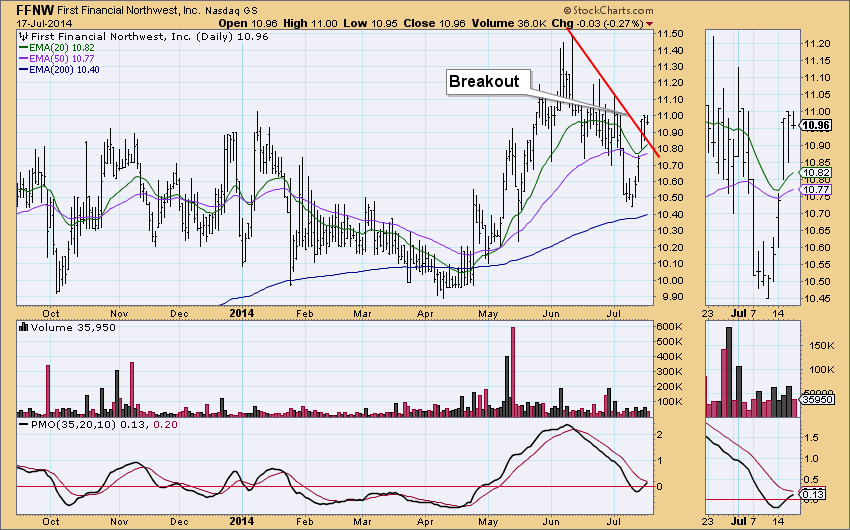
Price broke out above overhead resistance after a strong rally. I like that the PMO is in neutral territory and has plenty of room to rise. Price has been consolidating since the breakout, so it could be the start of a bullish flag formation.
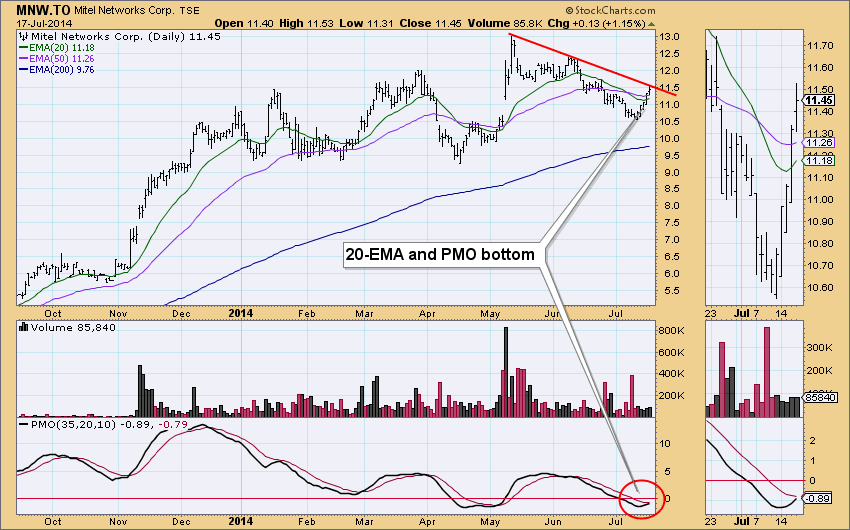
This chart shows price hitting resistance right as the PMO bottomed and the 20-EMA is rising to crossover the 50-EMA which would generate an intermediate-term Trend Model BUY signal.
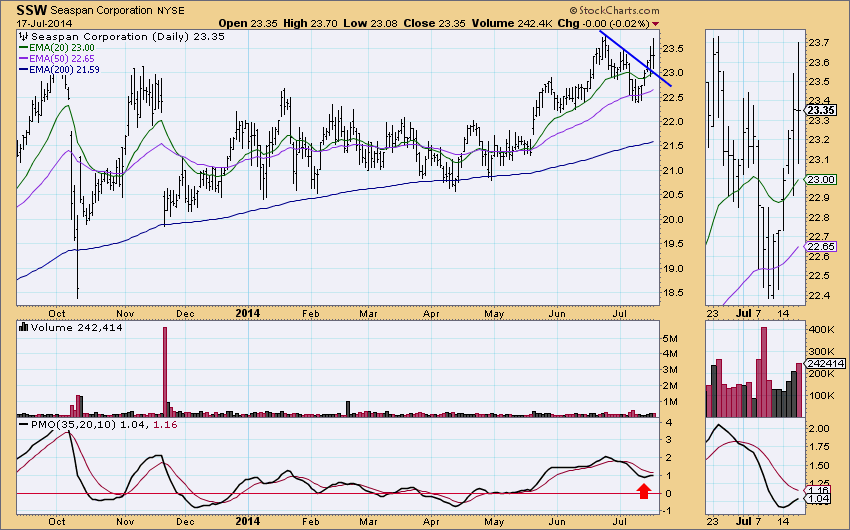
SSW broke out above the declining tops trend line. The PMO is nearing a positive crossover in neutral territory and has plenty of room to rise before hitting overbought territory. Like BX, SSW is on long-term and intermediate-term Trend Model BUY signals because the 20-EMA is above the 50-EMA which is above the 200-EMA.
I love being able to develop scans that take advantage of both the PMO and the Trend Model. I've shown you the positive characteristics of these charts and why they were flagged but you should do your own analysis of the situation to decide whether these are actual investment opportunities. If you'd like to learn more about how to use DecisionPoint indicators in your charts and scans, I highly recommend you come to ChartCon 2014 in a few weeks and attend my DecisionPoint breakout session. For those of you already signed up, I'm really looking forward to meeting you!
Happy Charting!
Erin


