Sentiment has traditionally been measured by taking polls of selected groups of investors, advisors, investing professionals, etc. There have been and still are problems associated with this methodology: (1) The polls are normally taken over a period of several days, during which time market movement and investor outlook can change radically; (2) The responses are strictly subjective, reflecting the emotional status of the person being polled, not necessarily his/her investment position.
The idea behind using sentiment indicators is that we are trying to determine when investors have reached a saturation point of bullishness or bearishness. For example, tops are formed when everybody who is going to buy has bought, and bottoms occur after there is no one left to sell. Using subjective measures like sentiment polls makes it difficult to determine exactly when these extremes have been reached, and polls have never been particularly good for bottom or top picking. I have always maintained an awareness of sentiment, but have been reluctant to make it one of my primary decision-making tools.
THE RYDEX ASSET RATIO
The Rydex Asset Ratio makes it possible for us to analyze sentiment based upon what investors are actually doing with real money. We do this by calculating a daily bear/bull asset ratio and monitoring the relationship between assets in the two types of funds. When the Rydex Asset Ratio was invented by Steve Todd (Todd Market Forecast) many years ago, it was based on two very small mutual funds -- URSA (bear) and NOVA (bull). Because of the small amount of cash involved (and, presumably, the small number of people using the funds), it was subject to extreme movement in either direction, but over the years Rydex added dozens of new funds. Where initially total assets in the two Rydex funds might have been a few hundred million dollars, today Rydex has over 40 funds with billions of dollars in assets. This is a more stable platform from which to derive indicators.
NOTE: The Rydex company was eventually purchased by Guggenheim Investments, and all the Rydex mutual funds were renamed with the Guggenheim prefix, but we continue to use the legacy "Rydex" name for the Ratios.
Now let's discuss specific components of the Ratio calculations.
Bull Funds: All index funds that are long the stock market.
Sector Funds: All sector funds that are long the stock market. Precious Metals, Government Bond, Bond, Commodities, Strong Dollar, and Weak Dollar mutual funds are not included.
Bear Funds: All index funds that are short the stock market.
Money Market: Since money market funds are not invested in bull funds, we consider them to be a mildly bearish vote.
Rydex Asset Ratio Formula:
(Bear Fund Assets + Money Market) / (Bull Fund + Sector Fund Assets)
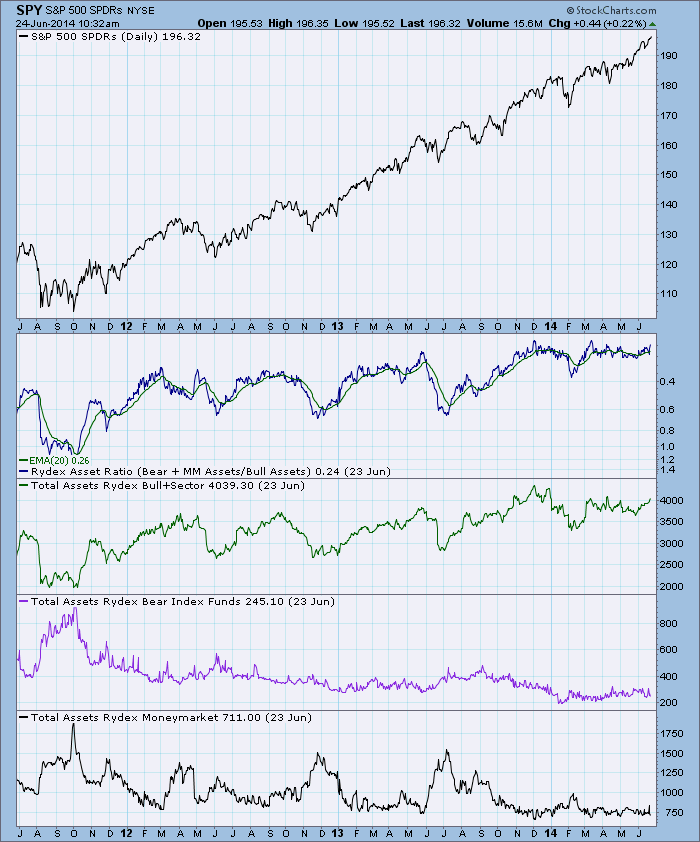
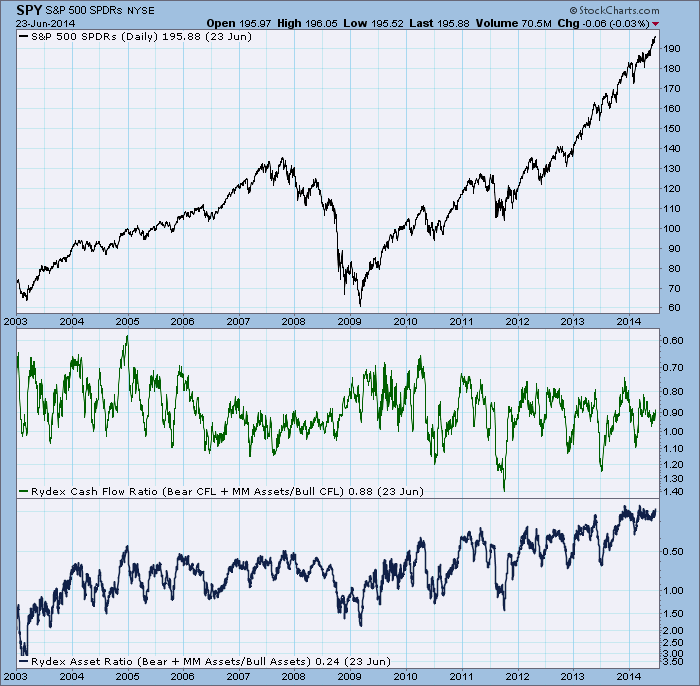
Below is a chart of the Asset Ratio with its components. Sometimes a careful look at the component charts can clarify movements of the Asset Ratio.
THE RYDEX CASH FLOW RATIO
In August 2004 Decision Point introduced the Rydex Cash Flow Ratio, which is based upon cumulative cash flow instead of total assets.
Cumulative Cash Flow (CCFL): We calculate and chart daily and cumulative net cash flow, which is the actual cash entering and leaving each fund in the Rydex group of funds. This is done by calculating the amount that total assets in a fund should have changed based upon the percentage change of per share net asset value (NAV), assuming that no cash was added to or taken out of the fund. We then subtract this amount from the actual amount of total assets in the fund, and the result is the daily net cash flow. We keep a cumulative total of the daily net cash flow. Total asset value tells us how much money is in the fund. Cumulative Cash Flow tells us how much cash was actually moved in or out of the fund. For example, on 8/18/2004 total assets in Rydex Bear Funds were $2.14 billion, but Cumulative Cash Flow totaled $3.09 billion. This means that bearish investors had lost about 31% of the amount they had invested in Rydex Bear Funds since April 1998, which is where our calculations begin.
NOTE: The results from independent calculations of CCFL will differ unless the starting point is the same. DecisionPoint's deep historical data for Rydex assets results in larger CCFL current numbers, which results in more stable CCFL ratios. Also, as CCFL totals increase over time, the Ratio will become less volatile, and the range will narrow.
Rydex Cash Flow Ratio Formula:
(Bear Funds CCFL + Money Market Fund) / (Bull Funds CCFL + Sector Funds CCFL)
We think that the Rydex Cash Flow Ratio is an improvement over the Rydex Asset Ratio, because it uses an estimate of money that has been committed to bull and bear funds, so it is a more accurate reflection the actual psychological extremes than asset levels are.
There are three components to CCFL: (1) Money that is worth as much as or more than when it was deposited; (2) money that is worth less than when it was deposited; and (3) money that has been abandoned -- the investor sold the shares for less than they cost. For example, an investor buys 10 shares for $100, redeeming the same 10 shares later for $70 -- a $30 loss. That $30 remains forever part of the CCFL total.
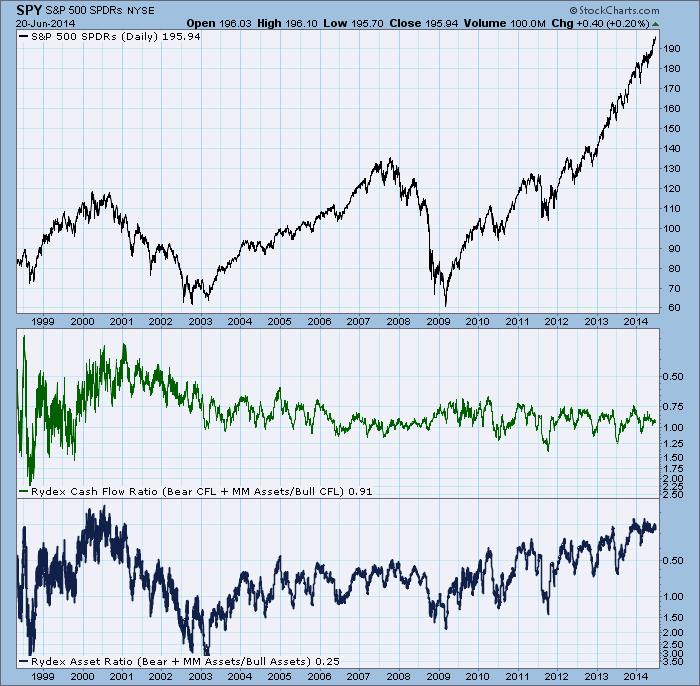
The chart below gives us good examples of extreme readings over a range of market conditions. When we compare the two Rydex Ratio indexes, we can see that the Cash Flow Ratio shows more consistent levels of support and resistance.
HOW TO USE THE RYDEX RATIOS
The Rydex Ratios can be used to gauge sentiment in three time frames, and for each we look at different elements. In our discussions, please note that the Ratio charts have a reverse-scale display to make interpretation of the charts more intuitive by giving overbought and oversold readings the same orientation as on the price chart. We will refer to high/low, up/down based upon that orientation.
Short-Term Analysis: For the short-term it is best to view the Ratios within the context of some kind of overlay. Either the Cash Flow or Asset Ratio can be used. We use a 20-EMA with Bollinger Bands. On the chart below, note that short-term excesses of bullishness or bearishness are identified when the Ratio tops or bottoms near the limits of the Bollinger Bands.
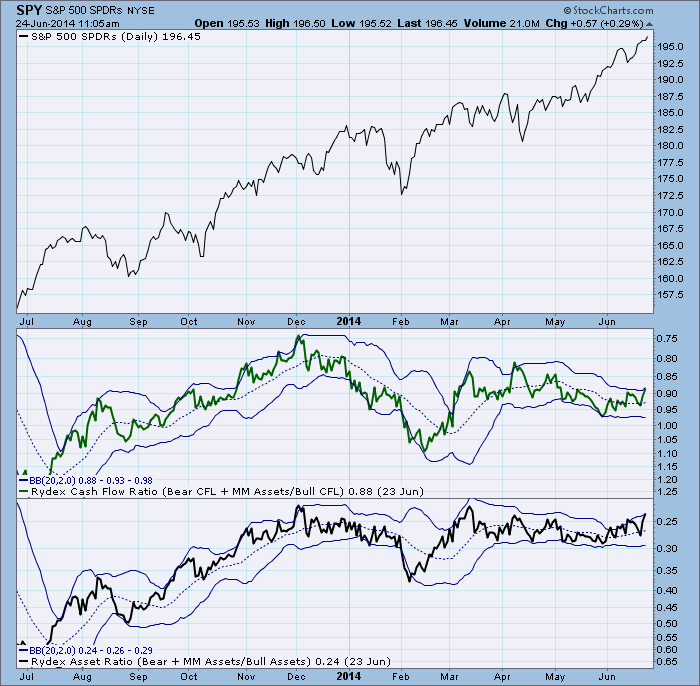
You will also notice that, when the market is trending, the Ratio tends to stay on one side or the other of the 20-EMA. During these periods, the 20-EMA becomes support or resistance, and enforces more narrow limits of what is considered overbought or oversold.
Contact with the Bands is not always a sign that the move has reached a short-term limit. When the Ratio makes a sharp 20-EMA crossover, it signals a possible shift in short-term sentiment. If it subsequently begins "pushing" the Bands in the direction of the crossover, it confirms the sentiment shift, and we need to wait for Ratio topping or bottoming action before speculating that sentiment has reached a short-term saturation point.
Medium-Term Analysis: While Bollinger Bands help define short-term excesses, medium-term excesses are gauged by looking at the trading range of the ratio over a period of several months. For this we think the Rydex Cash Flow is the best tool because it presents a view of the amount of dollars that have been recently committed to bullish or bearish funds, rather than the asset value, which is the current value of funds committed.
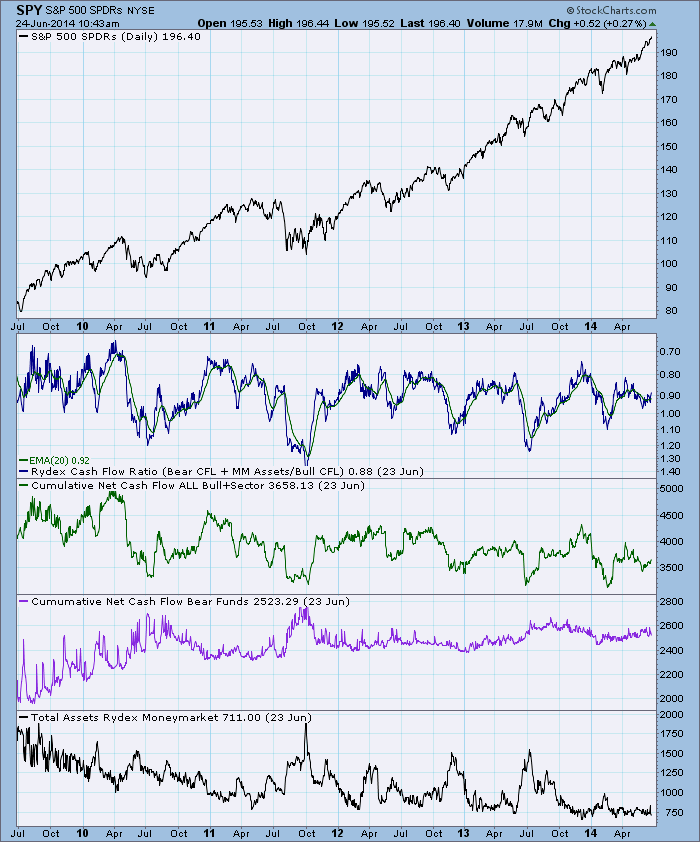
On the chart below we can see how the Cash Flow Ratio is able to maintain a fairly consistent trading range for extended periods, whereas the Asset Ratio is clearly influenced by price changes.
The Rydex Asset and Cash Flow Ratios are useful tools in evaluating market sentiment, because they are based on where people are putting their money, not just opinions. However, while we use the Ratios to infer broad market sentiment, we must remember that Rydex assets represent only a small fraction of assets in the total stock market.
