This is a sample of the DP Daily Update, which is available to StockCharts EXTRA and above subscribers. The purpose of the DecisionPoint Daily Update is to quickly review the day's action, internal condition, and Trend Model status of the broad market (S&P 500), the nine SPDR Sectors, the U.S. Dollar, Gold, Crude Oil, and Bonds. To ensure that using this daily reference will be quick and painless, we are as brief as possible, and often we let a chart speak for itself.
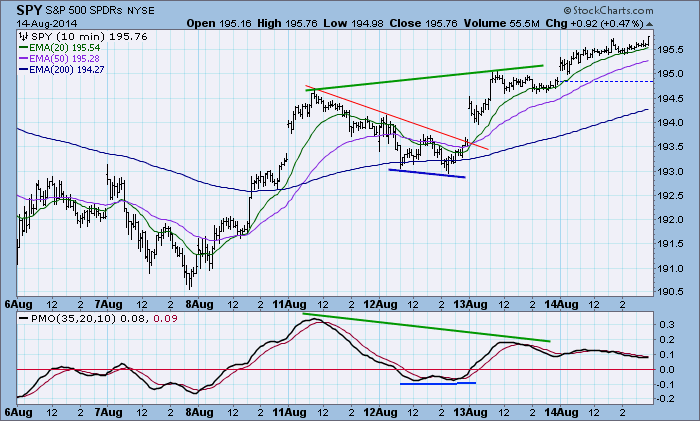
The PMO negative divergence persists on the 10-minute bar chart, as the market continues drifting higher.
SIGNALS: Here we include the current day's signal table, an excerpt from the DecisionPoint Alert Daily Report.
DECISIONPOINT ALERT DAILY REPORT
Thursday, 8/14/2014

************************ DECISIONPOINT MARKET POSTURE *************************************

The following is the market posture suggested by our mechanical trend-
following tools. These are not trading recommendations, rather they are price
activity flags that should be qualified by chart analysis. The Trend Model is
used on all indexes.


                                     Days   Index     08/14   Points  Percent   Prev Signal
Index               Posture     Date Elap  @Start     Close      P/L      P/L     P/L  Days
------------------- ------- -------- ---- -------   -------  -------  ------- ------- -----
Stocks Medium-Term  Bullish 02/11/14  184   180.32   195.76   +15.44    +8.6%
Stocks Long-Term    Bullish 02/11/14  184   180.32   195.76   +15.44    +8.6%
Gold (NY Spot)      Bullish 06/25/14   50  1322.60  1315.70    -6.90    -0.5%
20+Yr T-Bond  (TLT) Bullish 01/17/14  209   103.62   116.44   +12.82   +12.4%
------------------- ------- -------- ---- -------   -------  -------  ------- ------- -----
Dollar Index  (UUP) Bullish 07/21/14   24    21.47    21.74    +0.27    +1.3%
Commodities   (GSG) Neutral 07/14/14   31    32.64    31.00     ....     ....
Crude Oil     (USO) Neutral 07/30/14   15    36.92    35.11     ....     ....
------------------- ------- -------- ---- -------   -------  -------  ------- ------- -----
S&P 500       (SPY)     BUY 02/11/14  184   180.32   195.76   +15.44    +8.6%
S&P Equal Wt  (RSP)     BUY 11/30/12  622    51.02    76.09   +25.07   +49.1%
Dow           (DIA) Neutral 08/07/14    7   163.55   167.10     ....     ....
Nasdaq 100    (QQQ)     BUY 05/19/14   87    88.08    96.93    +8.85   +10.0%
NDX Equal Wt (QQEW)     BUY 05/23/14   83    37.24    39.49    +2.25    +6.0%
S&P 100       (OEF)     BUY 02/14/14  181    80.76    87.15    +6.39    +7.9%
S&P 400 MidCp (IJH) Neutral 08/05/14    9   136.65   139.59     ....     ....
S&P 600 SmlCp (IJR) Neutral 07/31/14   14   105.86   108.09     ....     ....
Total Market  (VTI)     BUY 12/10/12  612    70.60   101.26   +30.66   +43.4%
Consumer Disc (XLY)     BUY 05/29/14   77    65.41    67.25    +1.84    +2.8%
Cons Disc EWt (RCD)     BUY 05/30/14   76    78.72    81.21    +2.49    +3.2%
Consumer Stpl (XLP) Neutral 08/04/14   10    43.61    44.46     ....     ....
Cons Stpl EWt (RHS) Neutral 08/04/14   10    93.76    95.97     ....     ....
Energy        (XLE) Neutral 08/14/14    0    95.66    95.66 * Changed Today *  +10.1%   171
Energy EWt    (RYE) Neutral 08/08/14    6    88.35    87.44     ....     ....
Financial     (XLF)     BUY 02/13/14  182    21.45    22.69    +1.24    +5.8%
Financial EWt (RYF) Neutral 08/11/14    3    40.89    41.38     ....     ....
Health Care   (XLV)     BUY 04/29/14  107    57.85    61.90    +4.05    +7.0%
Health Cr EWt (RYH)     BUY 05/09/14   97   116.07   126.09   +10.02    +8.6%
Industrial    (XLI) Neutral 07/31/14   14    51.83    53.00     ....     ....
Industrl EWt  (RGI) Neutral 08/04/14   10    83.63    85.29     ....     ....
Materials     (XLB)     BUY 02/11/14  184    45.05    49.58    +4.53   +10.1%
Materials EWt (RTM)     BUY 02/13/14  182    78.25    84.45    +6.20    +7.9%
Technology    (XLK)     BUY 01/04/13  587    28.69    39.29   +10.60   +36.9%
Technolgy EWt (RYT)     BUY 05/19/14   87    79.16    84.25    +5.09    +6.4%
Utilities     (XLU) Neutral 08/01/14   13    41.41    41.81     ....     ....
Utilities EWt (RYU) Neutral 08/07/14    7    69.81    71.70     ....     ....

Average                               128                              +14.2%
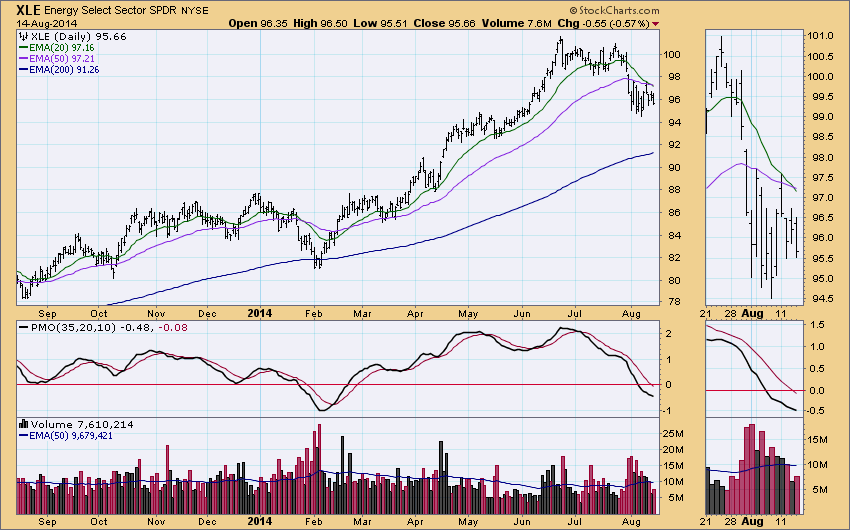
The Trend Model for the Energy SPDR (XLE) changed from BUY to NEUTRAL as the 20EMA crossed down through the 50EMA.
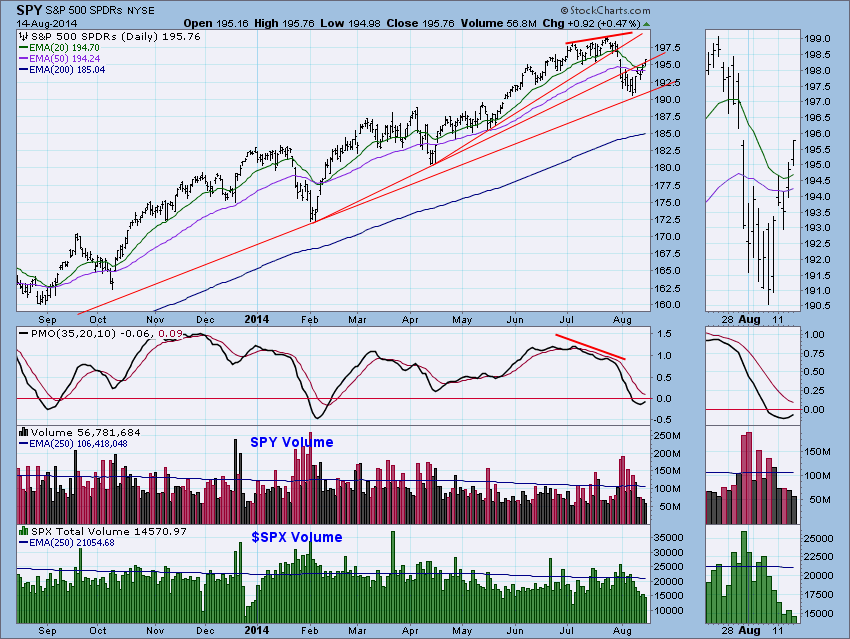
STOCKS: Based upon a 2/11/2014 Trend Model BUY signal, our current intermediate-term market posture for the S&P 500 (SPY) is bullish. The Trend Model, which informs our long-term outlook, is on a BUY signal as of 2/11/2014 so our long-term posture is bullish.
Price drifted above the line of resistance. It is far from a decisive move, but the outlook is positive. Again volume did not confirm.
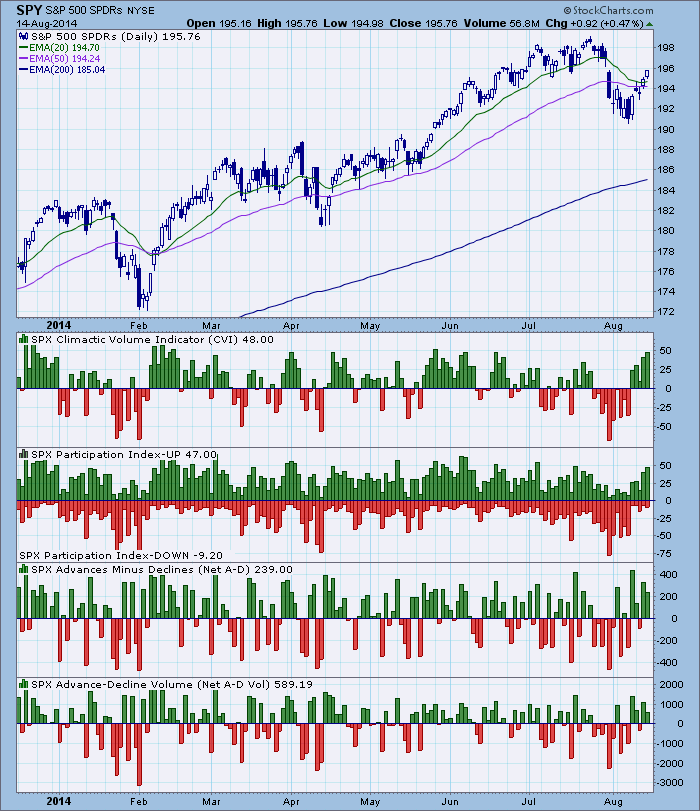
Ultra-Short-Term Indicators: The CVI and Participation-UP indicators had climactic readings today. The readings are not yet extreme, but they are high enough for us to start watching for a point of exhaustion for the price rally. The fact that net breadth and volume were not climactic is notable and might be a sign of exhaustion. Steady upward price pressure forces the CVI and PI-UP higher; whereas, net breadth and volume are one-day indicators and can hit opposite extremes from one day to the next.
Short-Term Indicators: They have penetrated their declining tops lines, which is positive, but they are now getting overbought. They can go higher for a day or two, but then they will not be helpful to the bullish case.
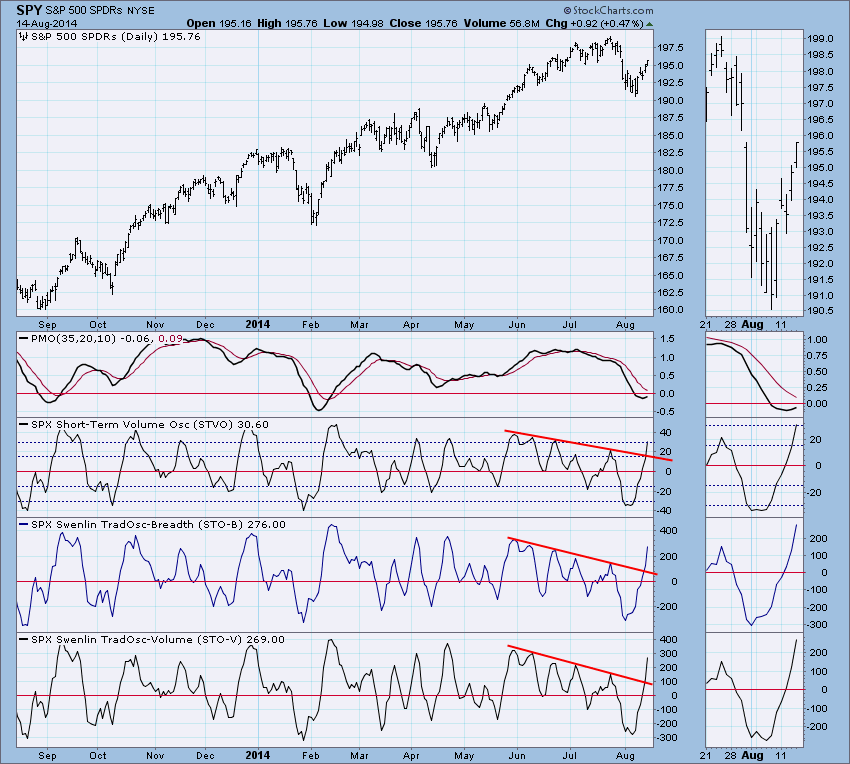
Intermediate-Term Indicators: They have bottomed and are crossing up through their EMAs. This is very positive for this time frame.
Conclusion: Ultra-short- and short-term indicators are running out of upside room, making things a bit precarious in those time frames; however, there are plenty of historical examples where prices have climbed, even as shorter-term indicators topped and fell. Intermediate-term indicators still show a positive picture.
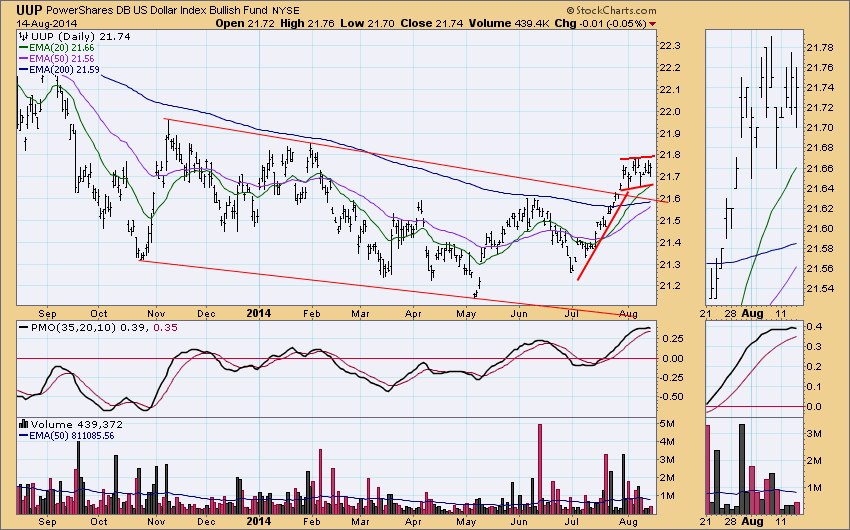
DOLLAR: As of 7/21/2014 the US Dollar Index ETF (UUP) is on a Trend Model BUY signal. The LT Trend Model, which informs our long-term outlook, is on a SELL signal as of 8/13/2013, so our long-term posture is bearish.
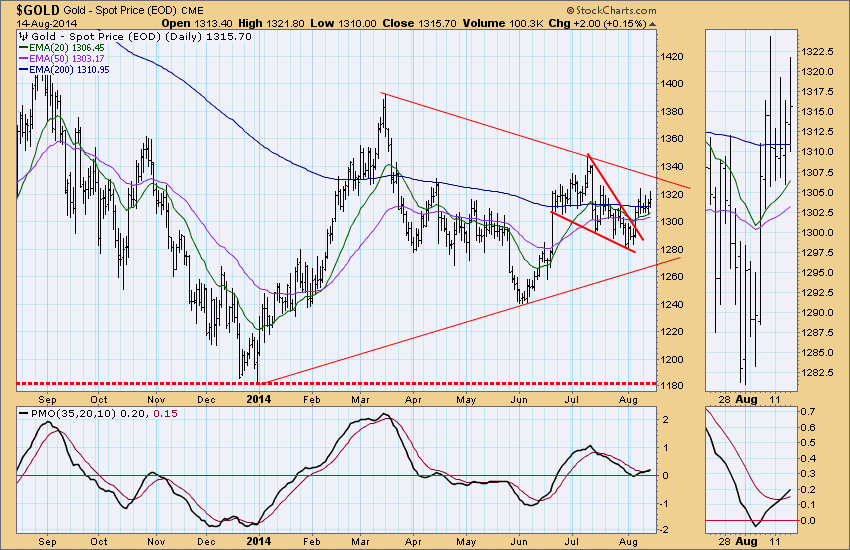
GOLD: As of 6/25/2014 Gold is on a Trend Model BUY signal. The LT Trend Model, which informs our long-term outlook, is on a SELL signal as of 2/15/2013, so our long-term posture is bearish.
Gold has formed a kind of flag formation on top of a short pole, so we can see this chart as slightly positive.
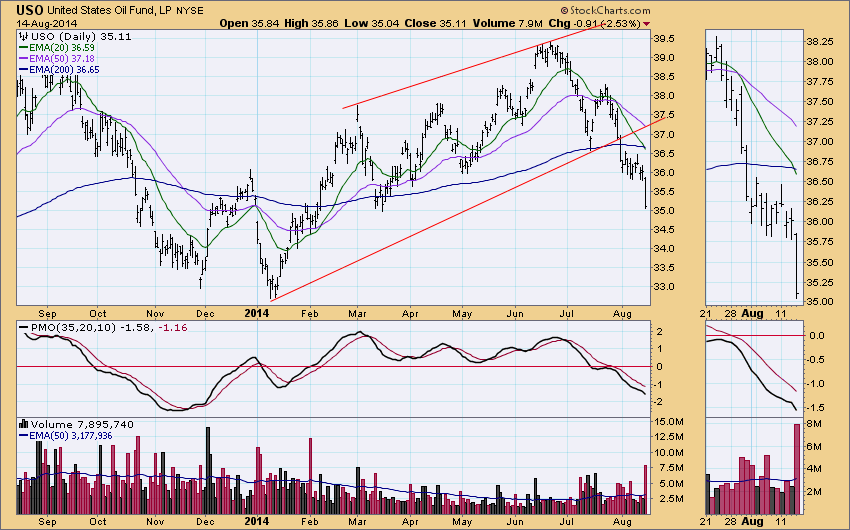
CRUDE OIL (USO): As of 7/30/2014 United States Oil Fund (USO) is on a Trend Model NEUTRAL signal. The LT Trend Model, which informs our long-term outlook, is on a BUY signal as of 2/26/2014, so our long-term posture is bullish.
USO was down -2.53% today on heavy volume. The reason given was that there are concerns about demand in the face of plentiful supply.
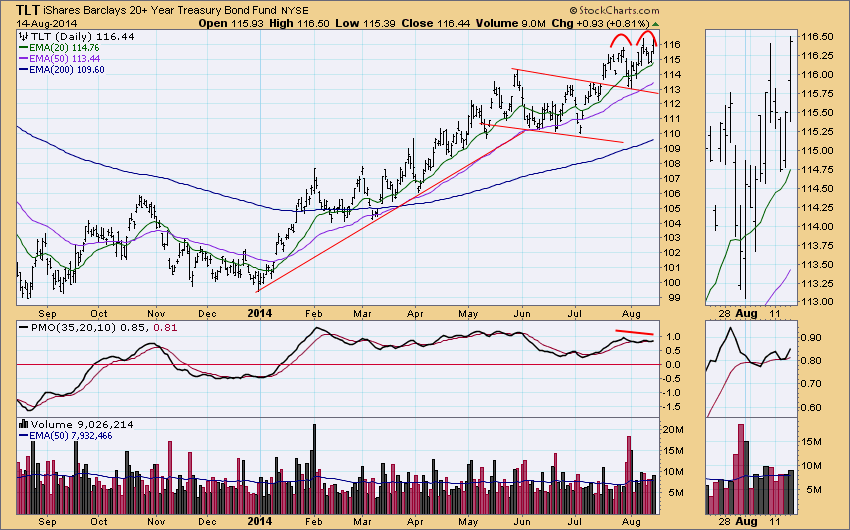
BONDS (TLT): As of 1/17/2014 The 20+ Year T-Bonds ETF (TLT) is on a Trend Model BUY signal. The LT Trend Model, which informs our long-term outlook, is on a BUY signal as of 3/24/2014, so our long-term posture is bullish.
The prospect for a double top is fading, and we will probably remove the annotations tomorrow.
Technical Analysis is a windsock, not a crystal ball.
- Carl


