At ChartCon last month, I had quite a few questions from attendees regarding our ultra-short-term indicators and how you distinguish a positive or negative spike in readings as either a price initiation or exhaustion. We had a great example this week. Readers of the DP Daily Update were able to see the analysis and commentary as it was happening in "real-time". In the Update, I analyzed the indicators and explained what we might be seeing as it was happening.
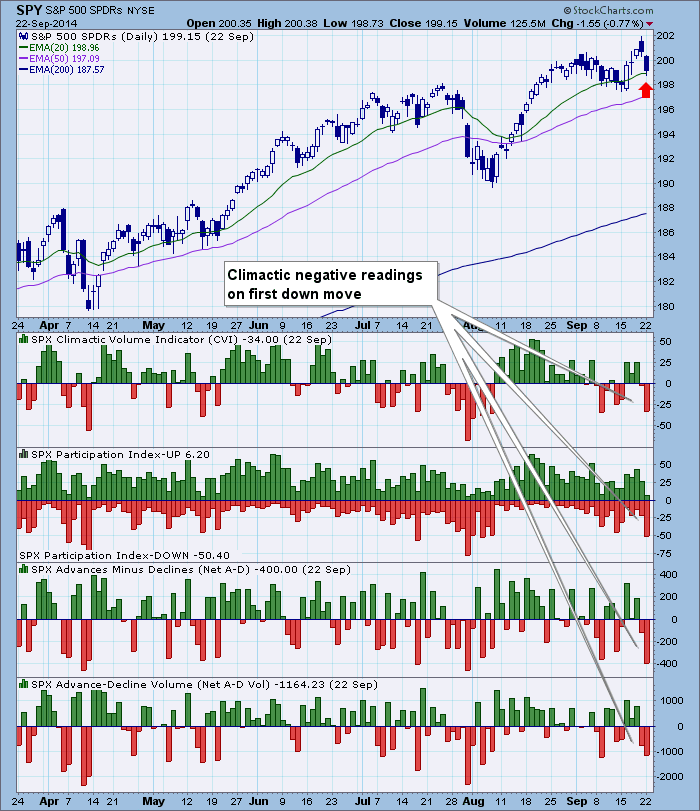
First, what is an initiation or exhaustion? When readings spike in the shorter-term indicators (intermediate-term indicators generally move much slower and will not spike), we call it an initiation or an exhaustion climax. An initiation climax usually occurs at a turning point in the market. For example, note in Monday's chart below, the readings on the CVI and Net Breadth indicators were much higher than normal. I commented that these high negative readings were likely an initiation climax or an "initiation" to lower prices. The market had been rallying, but on the first down day, we saw climactic readings. It was an initiation mainly because price was not already moving in the direction of the readings, in this case down.
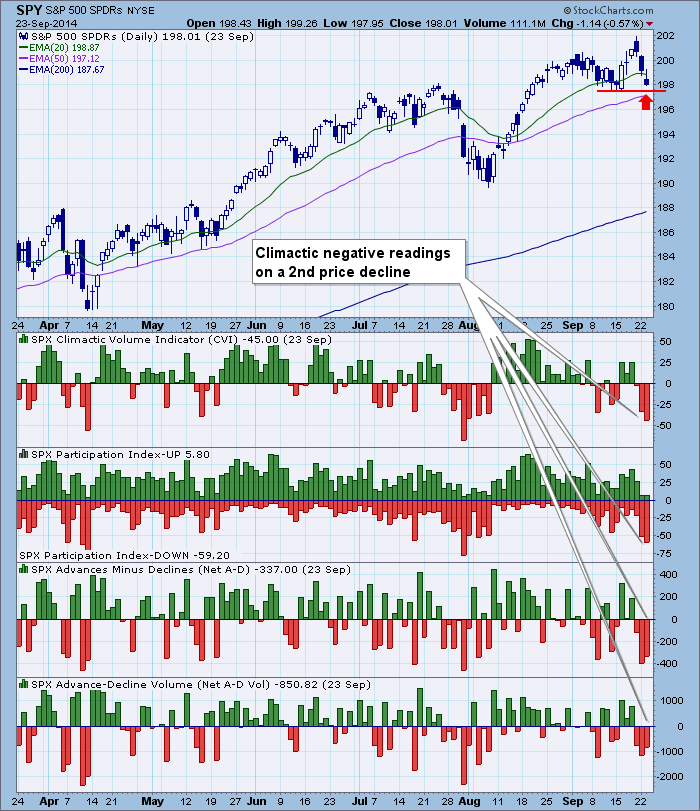
On the very next day, we got more negative climactic readings on the same indicators. In my analysis, I noted that it could be piggy-backing on the current initiation climax, but it was coming after a second sizable downward price move. In this case, it seemed more likely that it was an exhaustion climax. Basically price had a sizable drop in two days so it isn't unusual to see a bounce after that. A horizontal support line drawn from last week's low seemed to offer the opportunity for price to bounce. So in two days price had exhausted its move in the ultra-short term (measured in days).
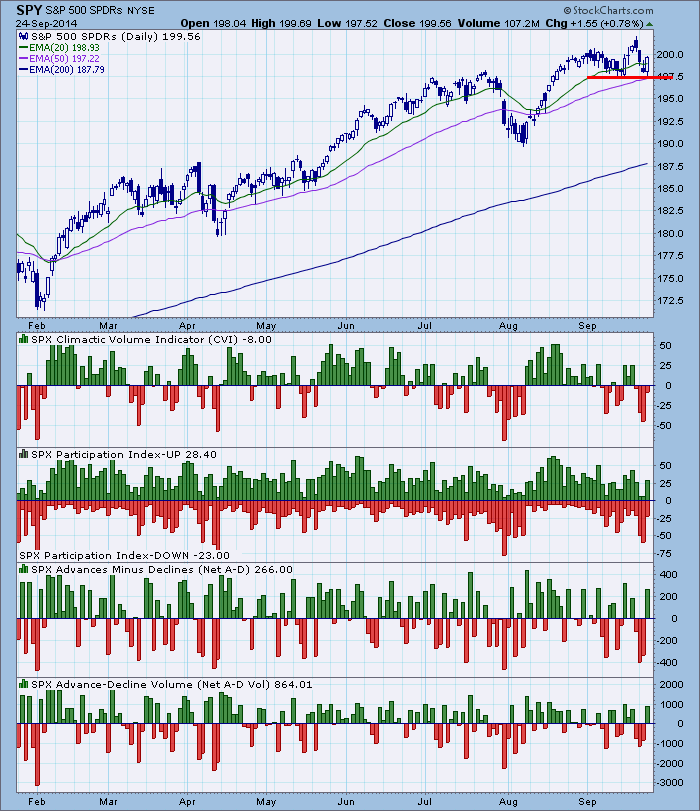
Today, we saw no climactic readings. Net Breadth was high, but given it was a very positive day, these readings are typical for today's market action. Note that we did get a bounce off of horizontal support at last week's low.
Obviously it isn't always this cut and dried and it sure is nice when the market cooperates. Determining whether a climactic reading is an initiation or exhaustion is not always easy. You can look at previous spikes on the charts above and see that it isn't always this uncomplicated. Here are the guidelines: Typically, if the climax happens during a direction change, it is an initiation. If it happens near the end of a move, it is likely an exhaustion.
Happy Charting!
Erin
