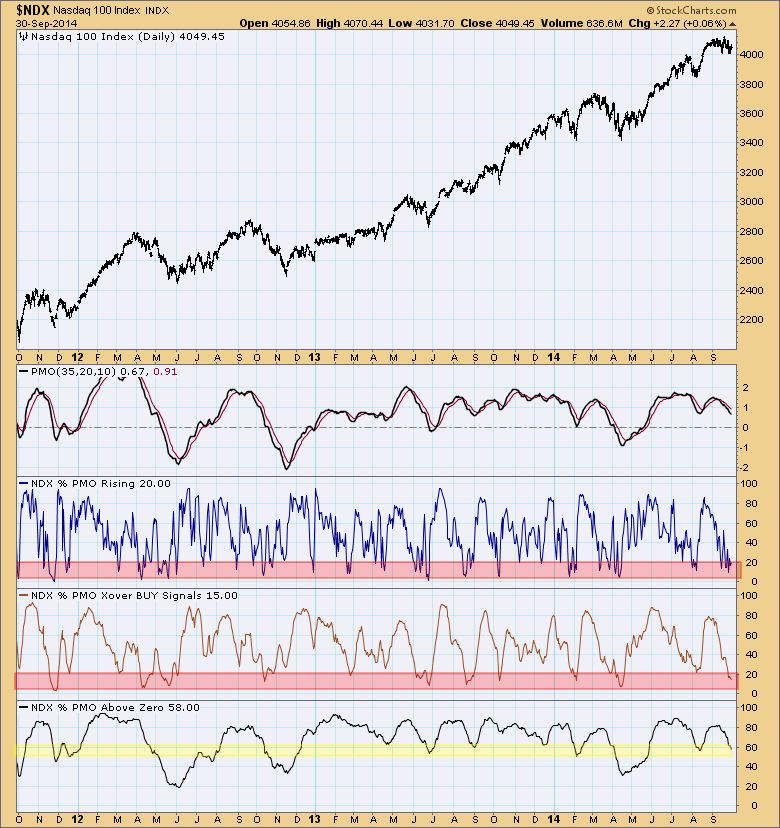
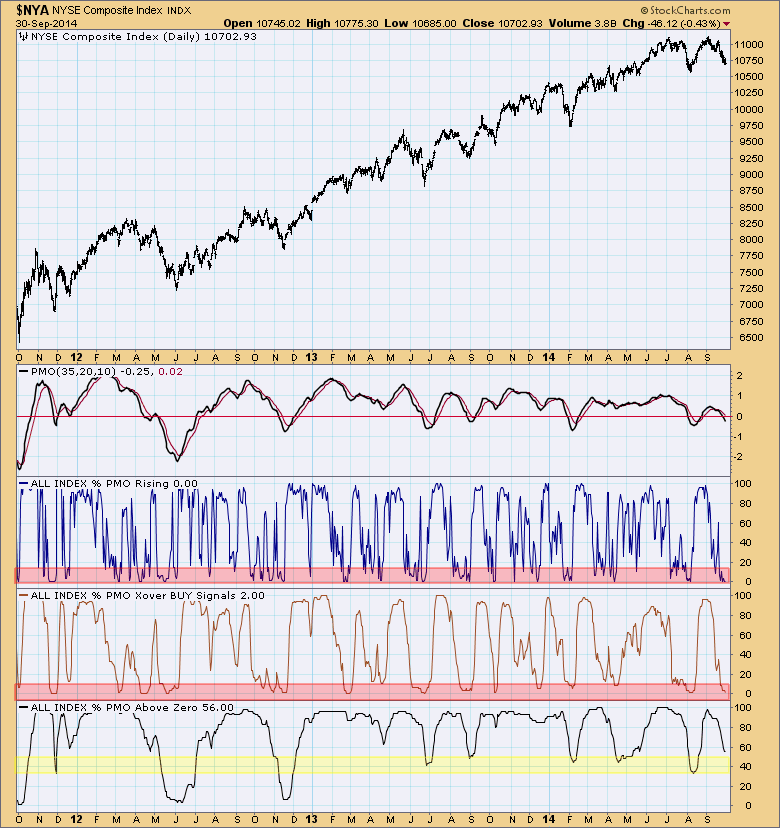
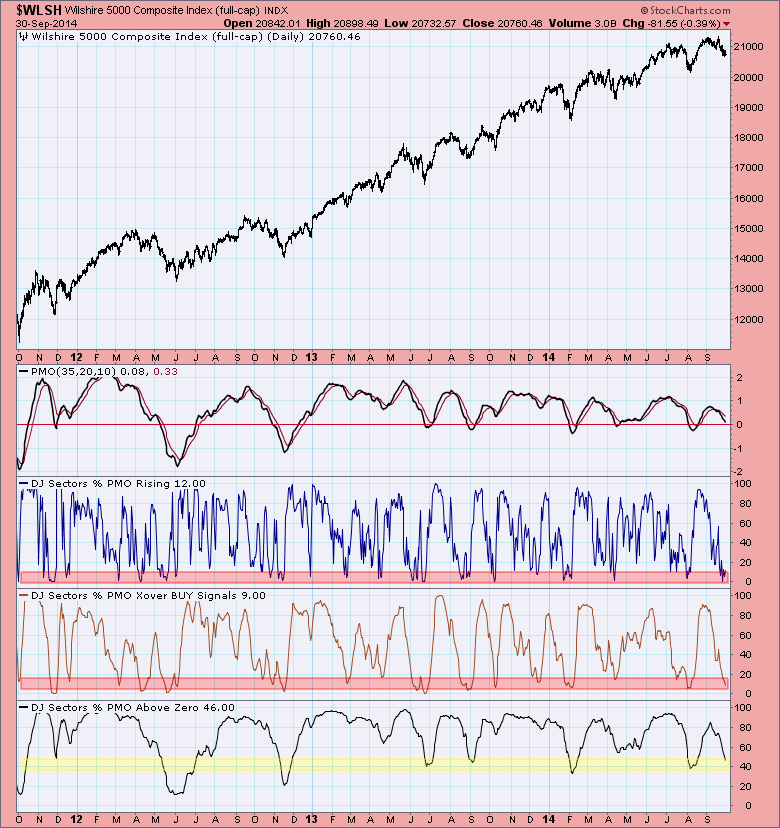
The Price Momentum Oscillator (PMO) is a measure of internal strength and momentum. You can read more about the PMO in ChartSchool. Every stock, index, ETF, mutual fund has a PMO value each day. It can be rising or falling, have a crossover BUY signal (or not) generated by the PMO crossing above its 10-EMA, and finally, it can have a value above or below zero. We calculate PMO Analysis charts based on those criteria. Note that you can only generate a PMO Analysis chart for an index or sector ETF because is comprised of a group of stocks. Since we are looking at percentages, we calculate the PMO value for each member of the group and use the values to calculate a percentage.
Looking through the DecisionPoint Market Indicator (DPMI) chart pack, I found these PMO analysis charts and noticed that they are all hitting oversold bottoms in the short term. Note in the first chart I have annotated the time frames for each indicator window. When you look at what is being measured it makes sense. In the short term, we are interested in how many stock members are rising. In the intermediate-term we count how many stocks are on a PMO BUY signal. In the longer term, we determine how many stocks in the group have values above zero. I've annotated on all of the charts areas of support. The red highlights are for readings that are in extremely oversold territory and could resolve upward. The yellow highlight is showing that readings are in oversold territory and have reached an area where many previous bottoms have occurred, but not quite in extremely oversold territory.
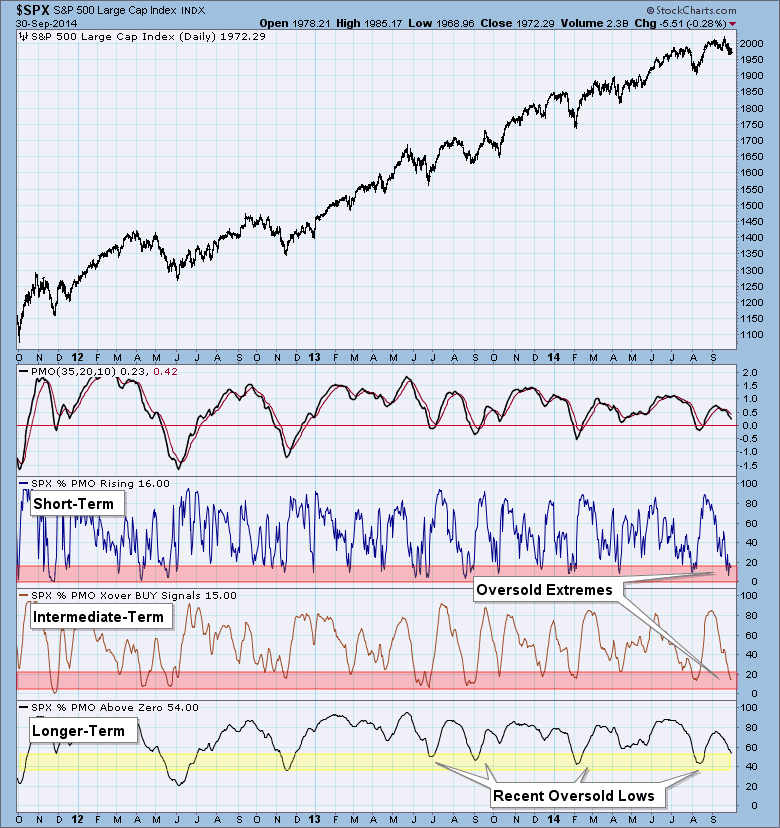
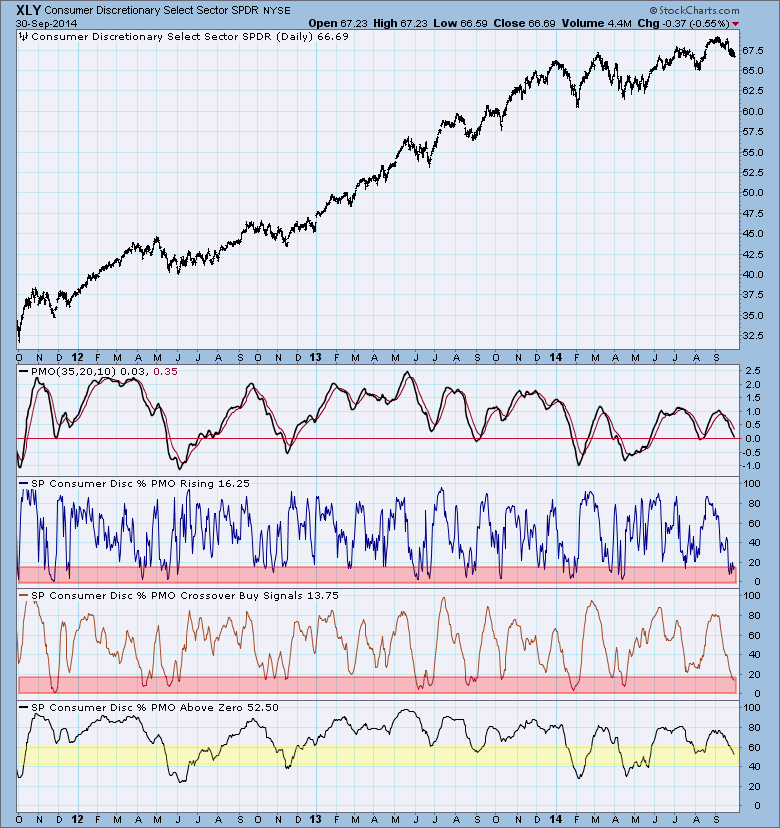
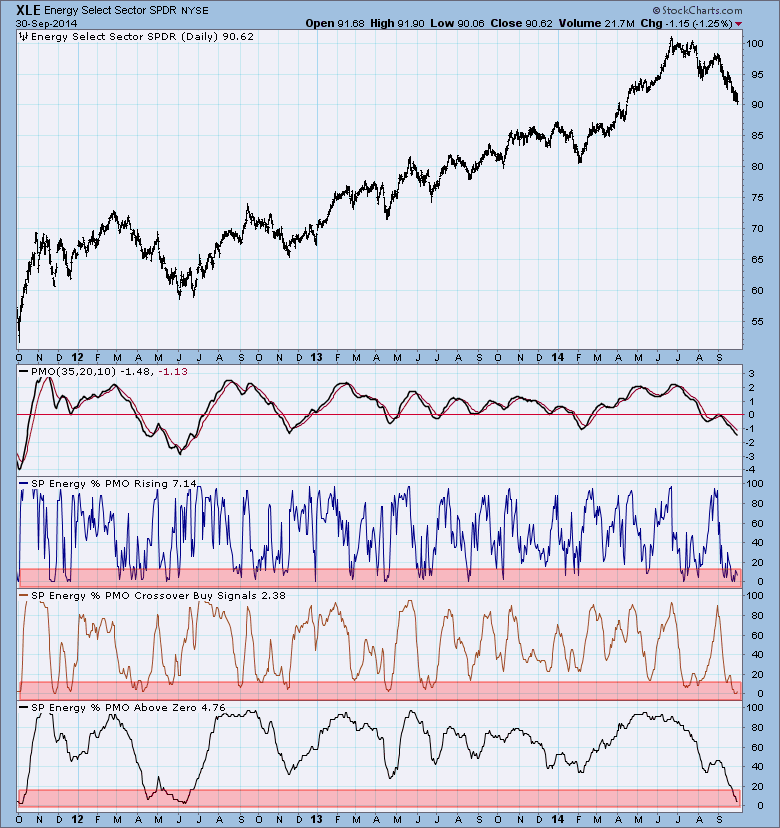
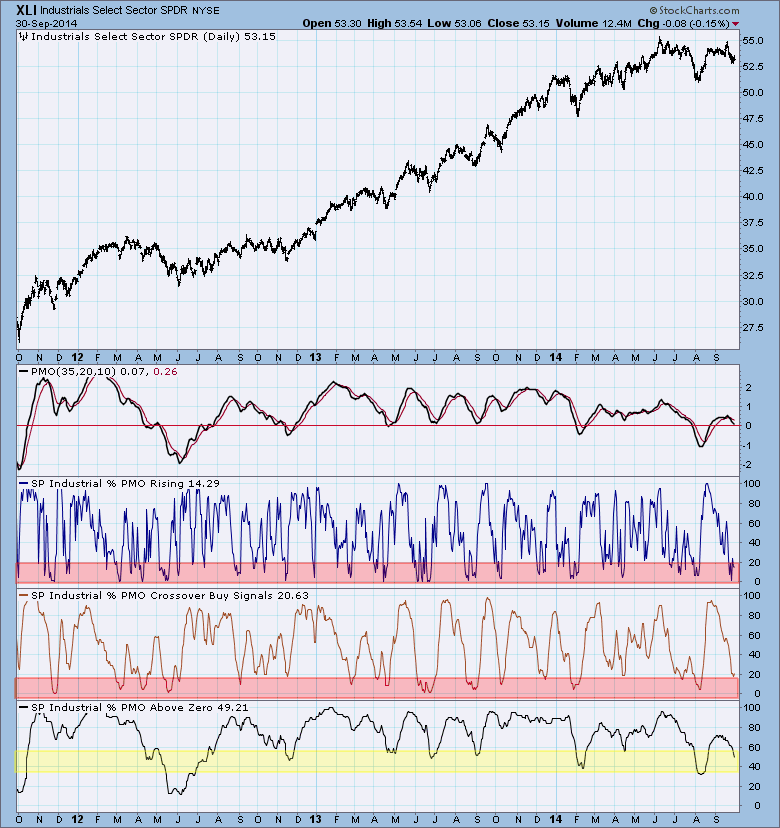
So what does this tell us? In the short term and intermediate term, indicators are oversold, implying a bullish resolution. However, longer-term indicators could get much more oversold, but because it has reached oversold territory where the indicator has in recent time bottomed, it could definitely support a rally.
If you'd like to be able to do your own quick review of flipping through the PMO Analysis charts, just download the DecisionPoint chart pack of market indicators and go to the ChartList named "DPMI - 1120 - PMO Analysis Charts".
Happy Charting!
Erin
