Note: The DP Weekly Update will now be published every Friday so we can analyze the final weekly charts.
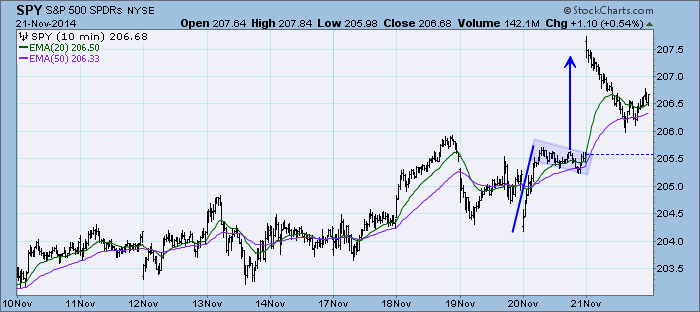
Price surged on the open likely helped by China lowering its interest rates for the first time in two years. After that it was all downhill. The bull flag executed first thing this morning and price made its way past the minimum upside target in the first twenty minutes of trading. That was unexpected mainly because today is options expiration and the Friday before a holiday week, so the expectation had been for high volume, low volatility.
The purpose of the DecisionPoint Daily Update is to quickly review the day's action, internal condition, and Trend Model status of the broad market (S&P 500), the nine SPDR Sectors, the U.S. Dollar, Gold, Crude Oil, and Bonds. To ensure that using this daily reference will be quick and painless, we are as brief as possible, and often we let a chart speak for itself.
SIGNALS: Here we include the current day's signal table, an excerpt from the DecisionPoint Alert Daily Report.
DECISIONPOINT ALERT DAILY REPORT
Friday, 11/21/2014

************************ DECISIONPOINT MARKET POSTURE ***********************

The following is the market posture suggested by our mechanical trend-
following tools. These are not trading recommendations, rather they are price
activity flags that should be qualified by chart analysis. The Trend Model is
used on all indexes.


                                     Days   Index     11/21   Points  Percent
Index               Posture     Date Elap  @Start     Close      P/L      P/L
------------------- ------- -------- ---- -------   -------  -------  -------
Stocks Medium-Term  Bullish 10/31/14   21   201.66   206.68    +5.02    +2.5%
Stocks Long-Term    Bullish 10/31/14   21   201.66   206.68    +5.02    +2.5%
Gold (NY Spot)      Bearish 08/21/14   92  1275.40  1197.70   +77.70    +6.1%
20+Yr T-Bond  (TLT) Bullish 01/17/14  308   102.88   120.10   +17.22   +16.7%
------------------- ------- -------- ---- -------   -------  -------  -------
Dollar Index  (UUP) Bullish 07/21/14  123    21.47    23.46    +1.99    +9.3%
Commodities   (GSG) Neutral 07/14/14  130    32.64    26.98     ....     ....
Crude Oil     (USO) Neutral 07/30/14  114    36.92    29.10     ....     ....
------------------- ------- -------- ---- -------   -------  -------  -------
S&P 500       (SPY)     BUY 10/31/14   21   201.66   206.68    +5.02    +2.5%
S&P Equal Wt  (RSP)     BUY 11/03/14   18    78.10    80.08    +1.98    +2.5%
Dow           (DIA)     BUY 10/31/14   21   173.01   177.70    +4.69    +2.7%
Nasdaq 100    (QQQ)     BUY 10/29/14   23    99.81   103.87    +4.06    +4.1%
NDX Equal Wt (QQEW)     BUY 10/30/14   22    40.66    42.46    +1.80    +4.4%
S&P 100       (OEF)     BUY 10/31/14   21    89.75    91.87    +2.12    +2.4%
S&P 400 MidCp (IJH)     BUY 11/05/14   16   141.76   144.36    +2.60    +1.8%
S&P 600 SmlCp (IJR)     BUY 11/03/14   18   111.40   111.30    -0.10    -0.1%
Total Market  (VTI)     BUY 11/03/14   18   104.08   106.37    +2.29    +2.2%
Consumer Disc (XLY)     BUY 11/05/14   16    67.55    70.09    +2.54    +3.8%
Cons Disc EWt (RCD)     BUY 11/03/14   18    82.86    85.85    +2.99    +3.6%
Consumer Stpl (XLP)     BUY 08/20/14   93    44.59    48.45    +3.86    +8.7%
Cons Stpl EWt (RHS)     BUY 10/21/14   31    98.15   104.00    +5.85    +6.0%
Energy        (XLE) Neutral 09/08/14   74    95.08    88.50     ....     ....
Energy EWt    (RYE) Neutral 09/08/14   74    87.04    78.66     ....     ....
Financial     (XLF)     BUY 10/29/14   23    23.44    24.21    +0.77    +3.3%
Financial EWt (RYF)     BUY 10/30/14   22    42.64    43.94    +1.30    +3.0%
Health Care   (XLV)     BUY 10/23/14   29    64.31    68.32    +4.01    +6.2%
Health Cr EWt (RYH)     BUY 05/09/14  196   115.95   140.19   +24.24   +20.9%
Industrial    (XLI)     BUY 10/30/14   22    54.67    57.18    +2.51    +4.6%
Industrl EWt  (RGI)     BUY 10/31/14   21    87.96    90.63    +2.67    +3.0%
Materials     (XLB)     BUY 11/18/14    3    49.87    50.67    +0.80    +1.6%
Materials EWt (RTM)     BUY 11/17/14    4    84.00    86.03    +2.03    +2.4%
Technology    (XLK)     BUY 10/31/14   21    40.54    41.67    +1.13    +2.8%
Technolgy EWt (RYT)     BUY 11/04/14   17    87.51    89.51    +2.00    +2.3%
Utilities     (XLU)     BUY 08/28/14   85    42.62    45.70    +3.08    +7.2%
Utilities EWt (RYU)     BUY 08/20/14   93    71.92    77.20    +5.28    +7.3%

Average                                38                               +4.4%
NOTE: Mechanical trading model signals define the implied bias of the price index based upon moving average relationships, but they do not necessarily call for a specific action. They are information flags that should prompt chart review. Further, they do not call for continuous buying or selling during the life of the signal. For example, a BUY signal will probably return the best results if action is taken soon after the signal is generated. Additional opportunities for buying may be found as price zigzags higher, but the trader must look for optimum entry points. Conversely, exit points to preserve gains (or minimize losses) may be evident before the model mechanically closes the signal.
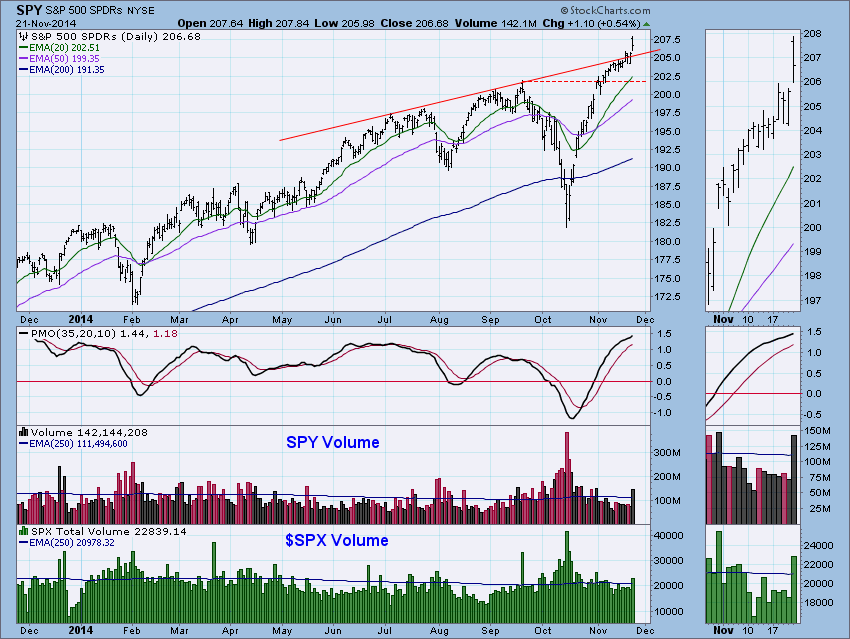
STOCKS: Based upon a 10/31/2014 Trend Model BUY signal, our current intermediate-term market posture for the S&P 500 (SPY) is bullish. The Trend Model, which informs our long-term outlook, is on a BUY signal as of 10/31/2014 so our long-term posture is bullish.
Price spent all day above overhead resistance after struggling to break through it significantly this week. Volume was high in line with options expiration.
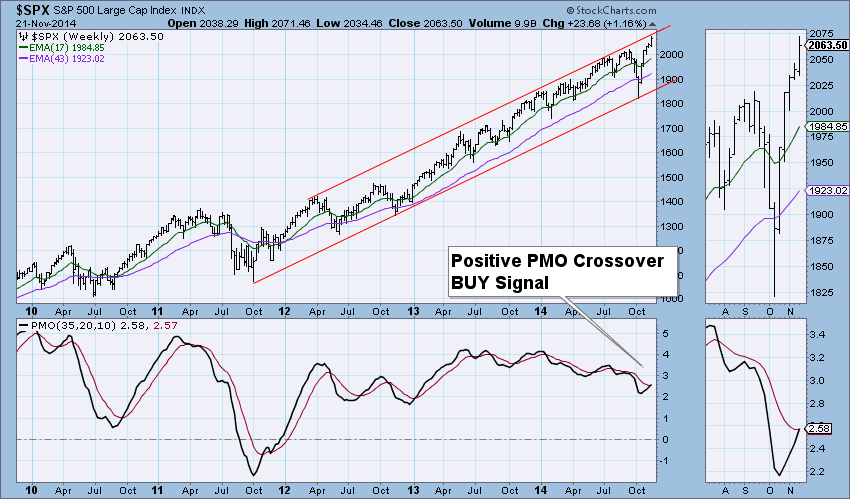
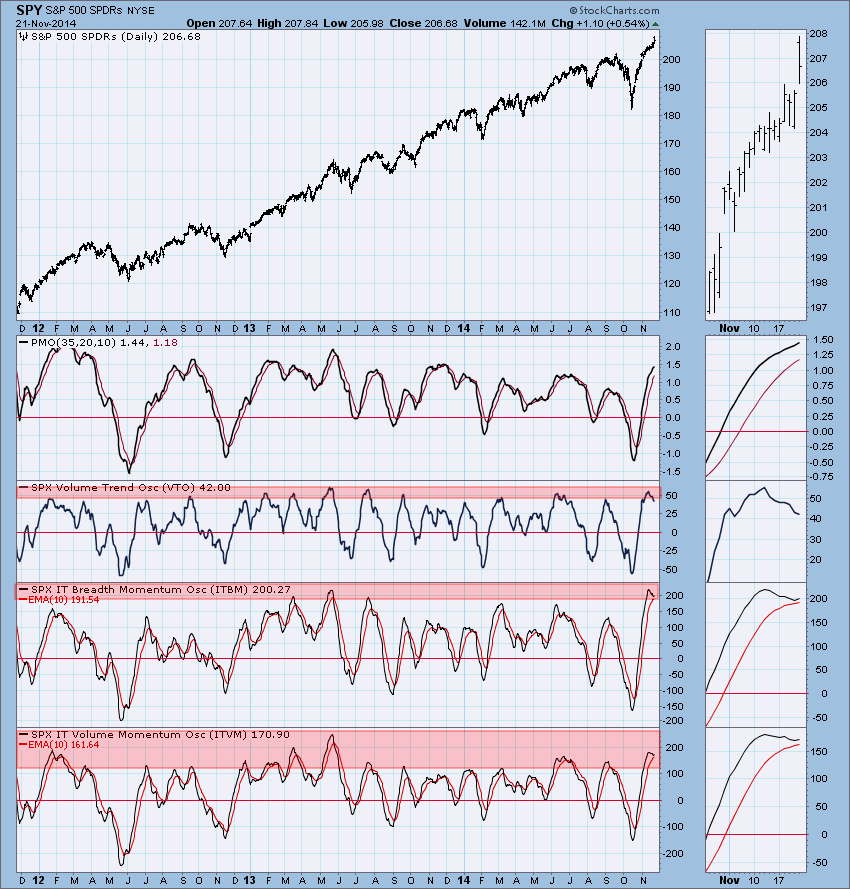
The weekly chart shows how price hit overhead resistance. We'd been watching this chart the past week as price continued to inch higher. Resistance was further away on the weekly chart but today's intraday hit it on the open. We know from the 10-minute bar chart that price was turned away right after it hit that line of resistance. The weekly PMO barely crossed its 10-EMA, but still generated a weekly PMO BUY signal.
Ultra-Short-Term Indicators: These indicators have climactic readings, not exceedingly so, but notable. This could go either way. The market has been mostly consolidating, so this could be an initiation to higher prices. However, the market is so overbought and long-term resistance on the weekly has been hit, so I think it is more likely an exhaustion and lower prices should be expected in the very short term.
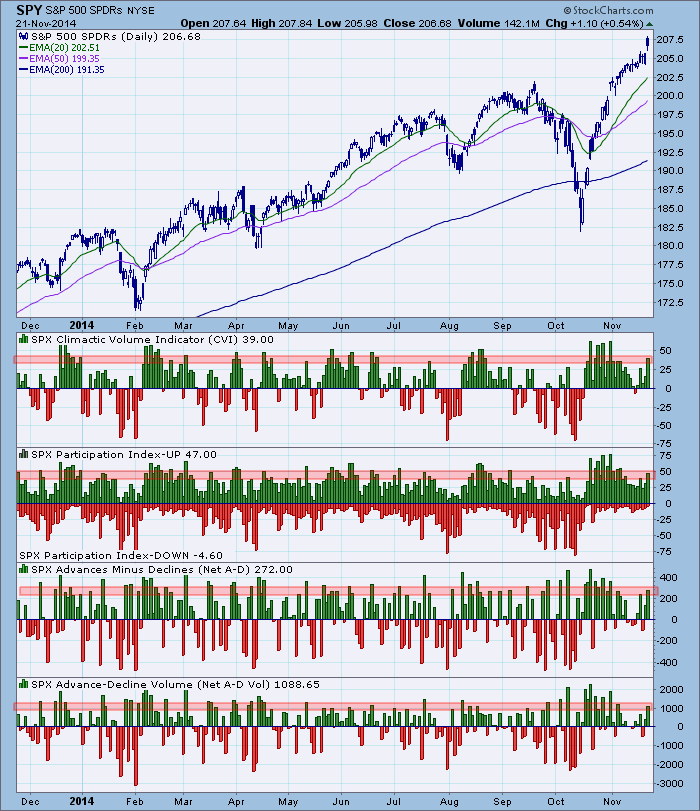
Short-Term Indicators: These indicators are rising but have not broken out of the declining trend they are in. Another reason this is likely not an initiation impulse on ultra-short-term indicators is that there was no confirmation on these indicators. They had a regular day and are still declining.
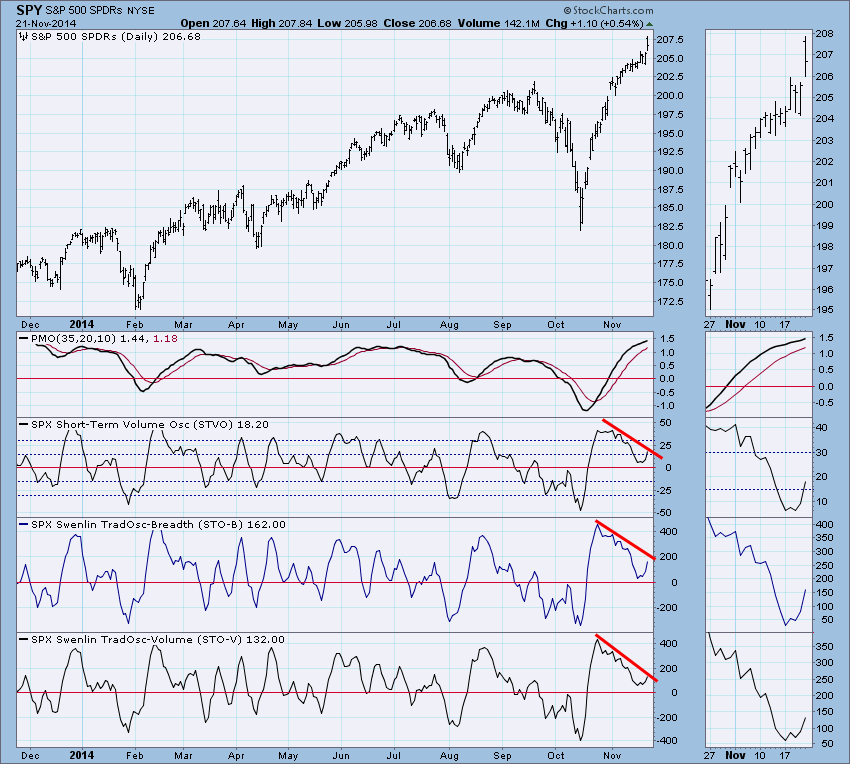
Intermediate-Term Indicators: They were headed for a negative crossover but today turned up slightly. Definitely not a convincing move. They continue to be extremely overbought, making intermediate-term conditions bearish.
Conclusion: The question is whether this was a sign of things to come or was it a last gasp before the pullback or correction? Given the overbought intermediate-term indicators, the impulse readings on the ultra-short-term indicators and short-term indicators that are in a declining trend, this is most likely an exhaustion.
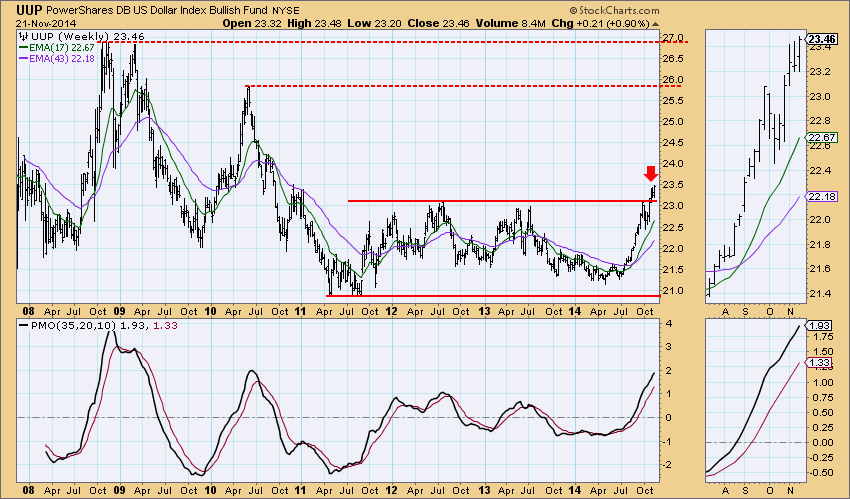
DOLLAR: As of 7/21/2014 the US Dollar Index ETF (UUP) is on a Trend Model BUY signal. The LT Trend Model, which informs our long-term outlook, is on a BUY signal as of 8/21/2014, so our long-term posture is bullish.
Price remains oscillating above support. The PMO is rising strongly. Looking in the thumbnail, we see price has been consolidating in what could possibly be a flag.
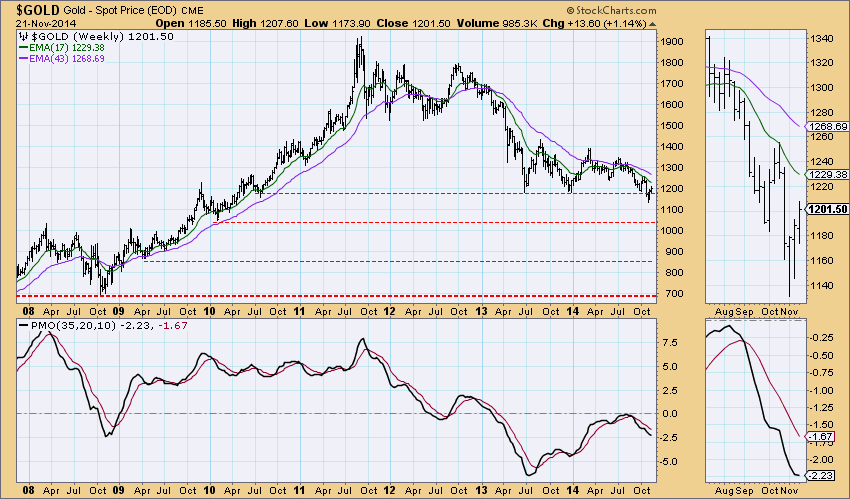
GOLD: As of 8/21/2014 Gold is on a Trend Model SELL signal. The LT Trend Model, which informs our long-term outlook, is on a SELL signal as of 2/15/2013, so our long-term posture is bearish.
Price remained above horizontal support this week, but still hasn't come close to crossing its 17-week EMA. Staying above support is positive but the PMO, while it paused this week, is still falling.
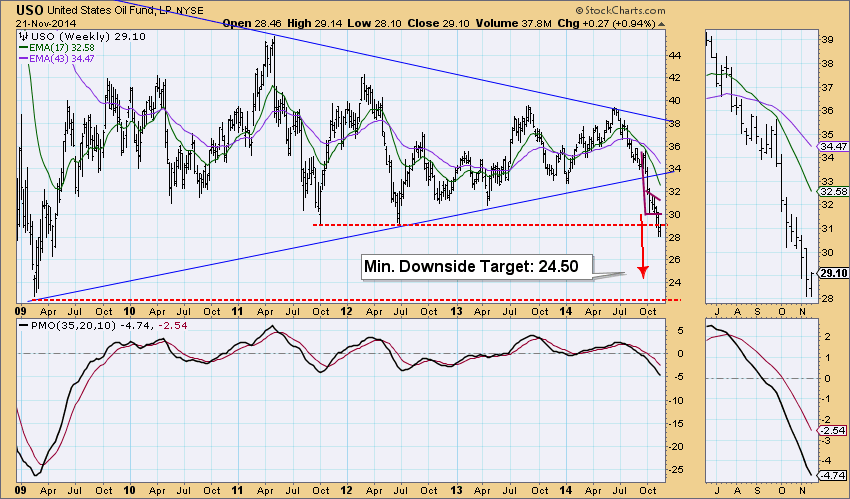
CRUDE OIL (USO): As of 7/30/2014 United States Oil Fund (USO) is on a Trend Model NEUTRAL signal. The LT Trend Model, which informs our long-term outlook, is on a SELL signal as of 8/28/2014, so our long-term posture is bearish.
The bear flag executed last month. Price has been meandering lower, but hasn't had a significant breakdown. The minimum downside target (the length of the flagpole from the flag) is around 24.50. USO is not showing the signs of life necessary to pull out of the decline just yet.
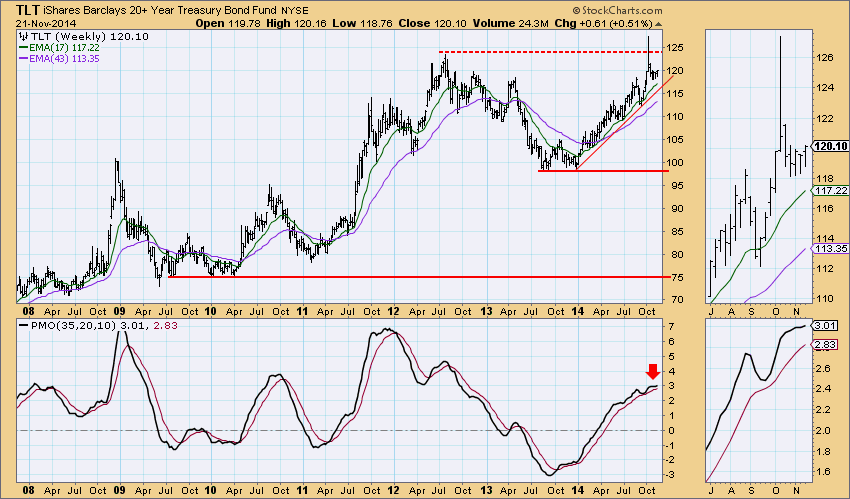
BONDS (TLT): As of 1/17/2014 The 20+ Year T-Bonds ETF (TLT) is on a Trend Model BUY signal. The LT Trend Model, which informs our long-term outlook, is on a BUY signal as of 3/24/2014, so our long-term posture is bullish.
Bond continue to consolidate, even on the weekly chart. The PMO is rising and price has not tested support yet. It's very early, but if TLT breaks down, we could be looking at a very large bearish double-top formation.
Technical Analysis is a windsock, not a crystal ball.
Happy Charting!
- Erin
