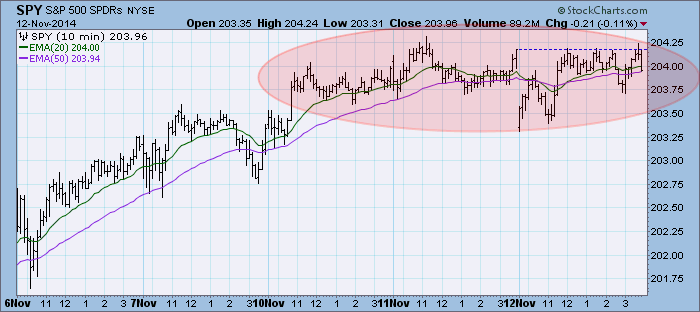
Price continues to consolidate. The market seems to be disinterested in a breakdown.
The purpose of the DecisionPoint Daily Update is to quickly review the day's action, internal condition, and Trend Model status of the broad market (S&P 500), the nine SPDR Sectors, the U.S. Dollar, Gold, Crude Oil, and Bonds. To ensure that using this daily reference will be quick and painless, we are as brief as possible, and often we let a chart speak for itself.
SIGNALS: Here we include the current day's signal table, an excerpt from the DecisionPoint Alert Daily Report.
DECISIONPOINT ALERT DAILY REPORT
Wednesday, 11/12/2014

************************ DECISIONPOINT MARKET POSTURE ***********************

The following is the market posture suggested by our mechanical trend-
following tools. These are not trading recommendations, rather they are price
activity flags that should be qualified by chart analysis. The Trend Model is
used on all indexes.


                                     Days   Index     11/12   Points  Percent
Index               Posture     Date Elap  @Start     Close      P/L      P/L
------------------- ------- -------- ---- -------   -------  -------  -------
Stocks Medium-Term  Bullish 10/31/14   12   201.66   203.96    +2.30    +1.1%
Stocks Long-Term    Bullish 10/31/14   12   201.66   203.96    +2.30    +1.1%
Gold (NY Spot)      Bearish 08/21/14   83  1275.40  1159.10  +116.30    +9.1%
20+Yr T-Bond  (TLT) Bullish 01/17/14  299   102.88   118.63   +15.75   +15.3%
------------------- ------- -------- ---- -------   -------  -------  -------
Dollar Index  (UUP) Bullish 07/21/14  114    21.47    23.33    +1.86    +8.7%
Commodities   (GSG) Neutral 07/14/14  121    32.64    26.99     ....     ....
Crude Oil     (USO) Neutral 07/30/14  105    36.92    29.14     ....     ....
------------------- ------- -------- ---- -------   -------  -------  -------
S&P 500       (SPY)     BUY 10/31/14   12   201.66   203.96    +2.30    +1.1%
S&P Equal Wt  (RSP)     BUY 11/03/14    9    78.10    78.99    +0.89    +1.1%
Dow           (DIA)     BUY 10/31/14   12   173.45   176.04    +2.59    +1.5%
Nasdaq 100    (QQQ)     BUY 10/29/14   14    99.81   102.46    +2.65    +2.7%
NDX Equal Wt (QQEW)     BUY 10/30/14   13    40.66    41.80    +1.14    +2.8%
S&P 100       (OEF)     BUY 10/31/14   12    89.75    90.76    +1.01    +1.1%
S&P 400 MidCp (IJH)     BUY 11/05/14    7   141.76   143.70    +1.94    +1.4%
S&P 600 SmlCp (IJR)     BUY 11/03/14    9   111.40   112.74    +1.34    +1.2%
Total Market  (VTI)     BUY 11/03/14    9   104.08   105.18    +1.10    +1.1%
Consumer Disc (XLY)     BUY 11/05/14    7    67.55    68.58    +1.03    +1.5%
Cons Disc EWt (RCD)     BUY 11/03/14    9    82.86    84.08    +1.22    +1.5%
Consumer Stpl (XLP)     BUY 08/20/14   84    44.59    47.86    +3.27    +7.3%
Cons Stpl EWt (RHS)     BUY 10/21/14   22    98.15   103.19    +5.04    +5.1%
Energy        (XLE) Neutral 09/08/14   65    95.08    86.49     ....     ....
Energy EWt    (RYE) Neutral 09/08/14   65    87.04    76.78     ....     ....
Financial     (XLF)     BUY 10/29/14   14    23.44    24.15    +0.71    +3.0%
Financial EWt (RYF)     BUY 10/30/14   13    42.64    43.71    +1.07    +2.5%
Health Care   (XLV)     BUY 10/23/14   20    64.31    67.86    +3.55    +5.5%
Health Cr EWt (RYH)     BUY 05/09/14  187   115.95   138.86   +22.91   +19.8%
Industrial    (XLI)     BUY 10/30/14   13    54.67    56.40    +1.73    +3.2%
Industrl EWt  (RGI)     BUY 10/31/14   12    87.96    89.94    +1.98    +2.3%
Materials     (XLB) Neutral 10/06/14   37    48.43    49.13     ....     ....
Materials EWt (RTM) Neutral 10/02/14   41    81.60    83.85     ....     ....
Technology    (XLK)     BUY 10/31/14   12    40.54    41.10    +0.56    +1.4%
Technolgy EWt (RYT)     BUY 11/04/14    8    87.51    88.15    +0.64    +0.7%
Utilities     (XLU)     BUY 08/28/14   76    42.62    45.50    +2.88    +6.8%
Utilities EWt (RYU)     BUY 08/20/14   84    71.92    76.60    +4.68    +6.5%

Average                                32                               +3.5%
NOTE: Mechanical trading model signals define the implied bias of the price index based upon moving average relationships, but they do not necessarily call for a specific action. They are information flags that should prompt chart review. Further, they do not call for continuous buying or selling during the life of the signal. For example, a BUY signal will probably return the best results if action is taken soon after the signal is generated. Additional opportunities for buying may be found as price zigzags higher, but the trader must look for optimum entry points. Conversely, exit points to preserve gains (or minimize losses) may be evident before the model mechanically closes the signal.
STOCKS: Based upon a 10/31/2014 Trend Model BUY signal, our current intermediate-term market posture for the S&P 500 (SPY) is bullish. The Trend Model, which informs our long-term outlook, is on a BUY signal as of 10/31/2014 so our long-term posture is bullish.
A very small top was formed at yesterday's high. Price seems to be turning over as it has reached overhead resistance. The PMO is still very positive, but it is getting overbought.
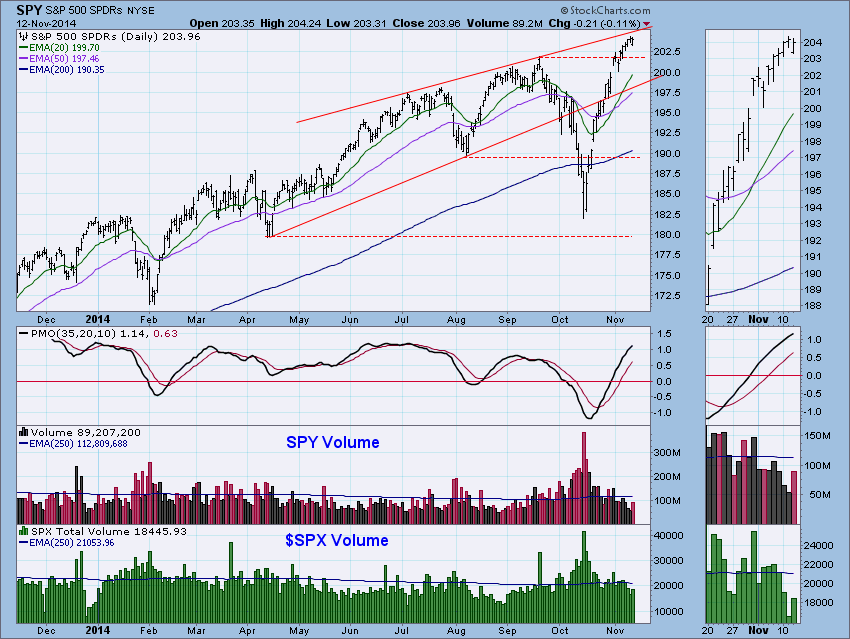
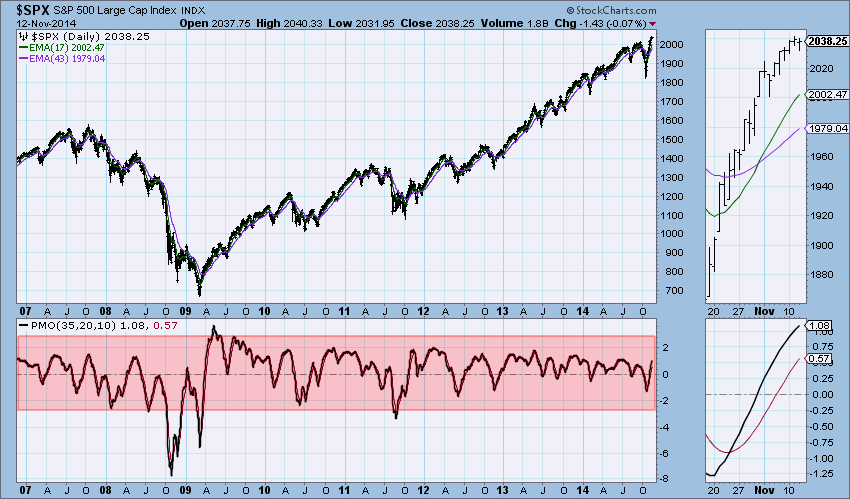
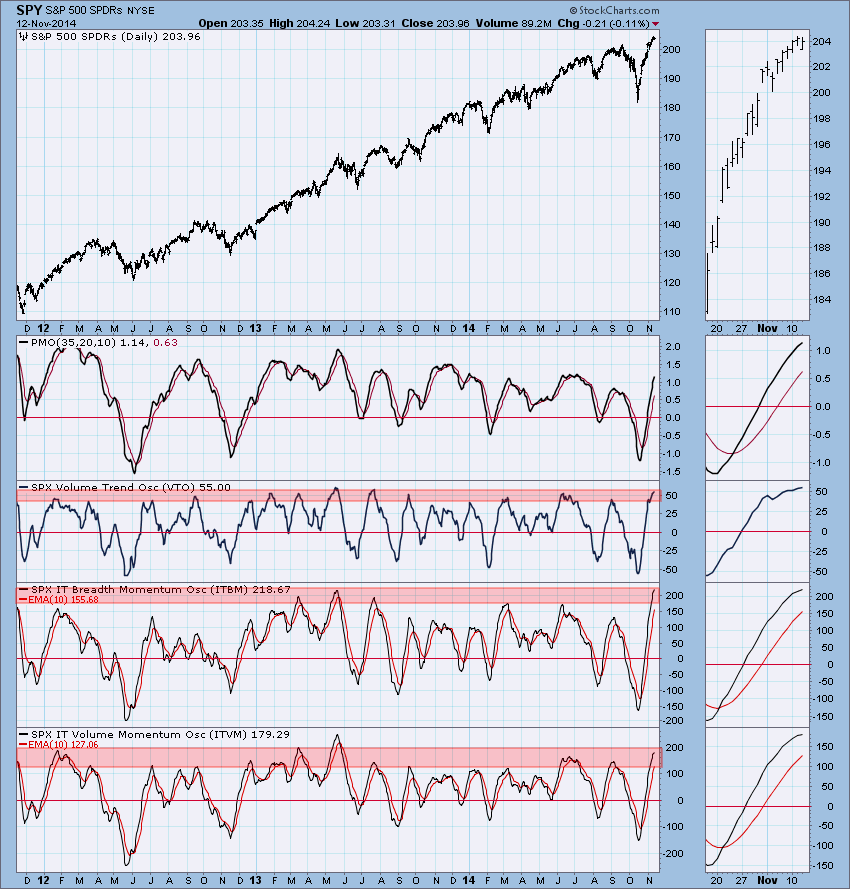
While it may appear that the PMO above is in very overbought territory, if you look at a longer-term chart, you can see that typically the PMO on the SPY oscillates between 2.5 and -2.5. I will caveat this by saying that the PMO is overbought right now when you compare it to recent readings, so I wouldn't get too comfortable with the fact that the PMO technically is not near the top of its range.
Ultra-Short-Term Indicators: Readings were not climactic. However, I noted that readings have been declining while price has been rising. This is bearish as it demonstrates internal weakness in the ultra-short term.
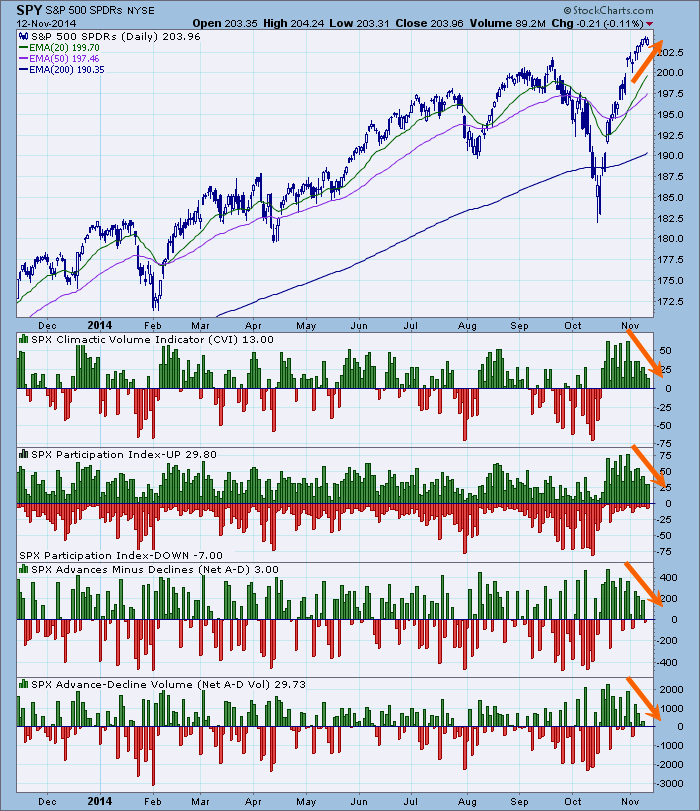
Short-Term Indicators: These indicators are also bearish. They are declining and leaving overbought territory which is positive, but like ultra-short-term indicators above, readings are declining while price is climbing.
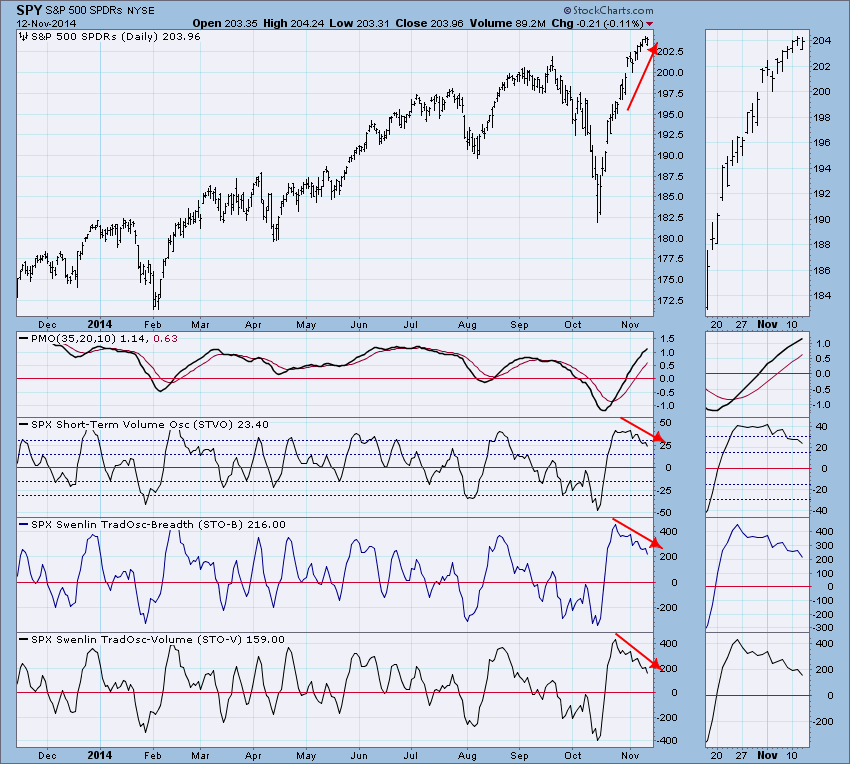
Intermediate-Term Indicators: Technically these indicators are bullish because they are rising, but that is preempted by the fact they are extremely overbought. They appear to be softening in preparation for a top which is bearish.
Conclusion: Indicators in all three time frames are bearish. Ultra-short- and short-term indicators identify internal weakness in the market. Intermediate-term indicators are starting to decelerate and could top very soon. When these IT indicators finally do top, it probably is time to prepare for a pullback.
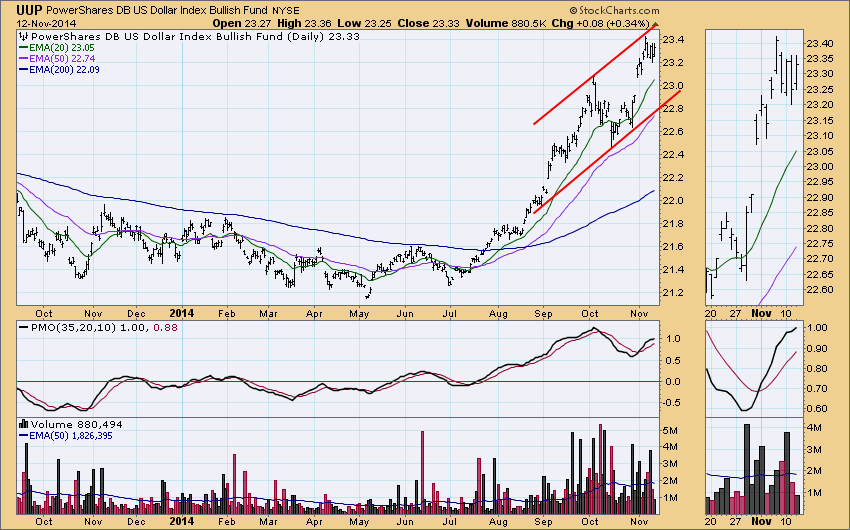
DOLLAR: As of 7/21/2014 the US Dollar Index ETF (UUP) is on a Trend Model BUY signal. The LT Trend Model, which informs our long-term outlook, is on a BUY signal as of 8/21/2014, so our long-term posture is bullish.
The dollar has been consolidating for about a week after topping early this month. The PMO had topped yesterday, but today's small gain was enough to turn it back up. The PMO still has room to rise before hitting the top of the current overbought range. It is overbought enough and the rising trend channel wide enough to make this a precarious entry point.
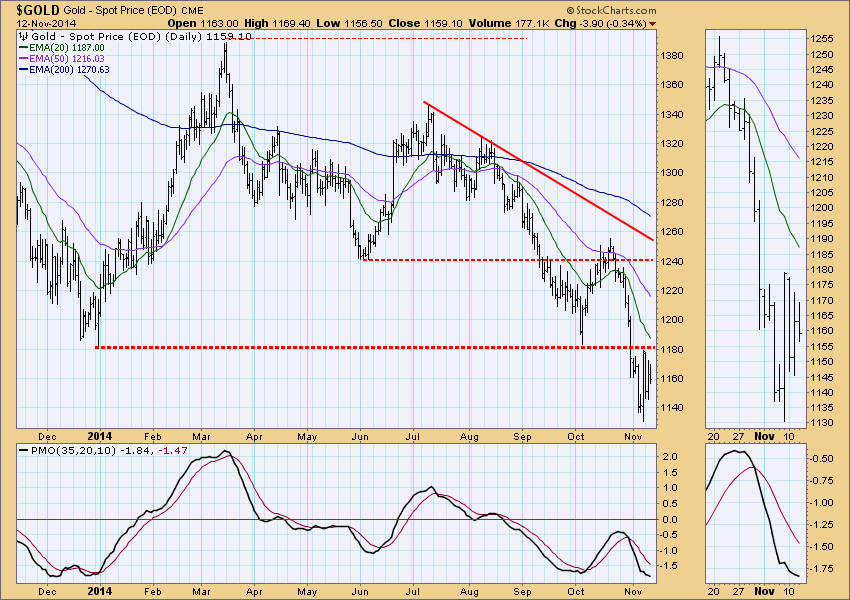
GOLD: As of 8/21/2014 Gold is on a Trend Model SELL signal. The LT Trend Model, which informs our long-term outlook, is on a SELL signal as of 2/15/2013, so our long-term posture is bearish.
Gold has been in a tall trading range, but in the thumbnail it appears that it is starting to form a triangle. Originally I had seen a bearish reverse flag, but the small flag didn't hold up. However, this new configuration could be read as a reverse flag with a larger pennant. The PMO has reached the bottom of its current range which normally could be considered positive, but we need to wait for it to bottom before it's actually bullish.
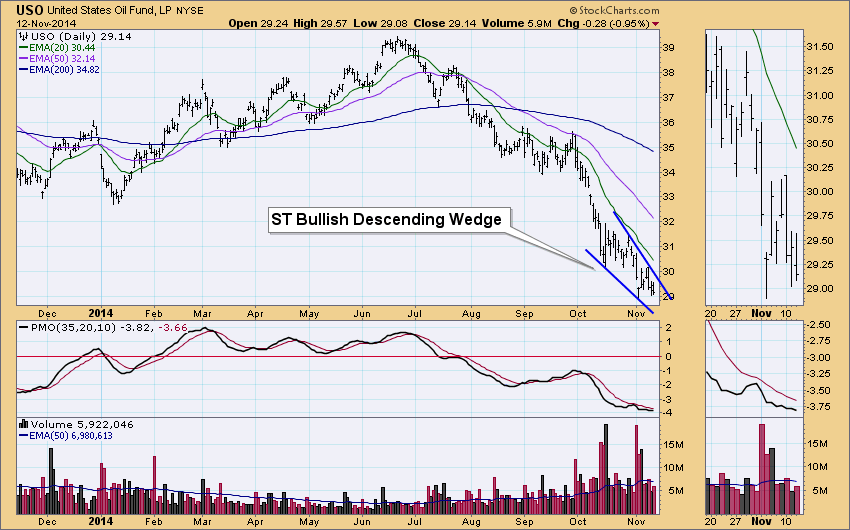
CRUDE OIL (USO): As of 7/30/2014 United States Oil Fund (USO) is on a Trend Model NEUTRAL signal. The LT Trend Model, which informs our long-term outlook, is on a SELL signal as of 8/28/2014, so our long-term posture is bearish.
I found what could be a short-term bullish falling wedge on USO. The PMO has flattened and is attempting to bottom in oversold territory. Rather than catch a falling knife on USO, I would definitely wait for a PMO positive crossover its 10-EMA and a breakout above the falling wedge before getting overly bullish.
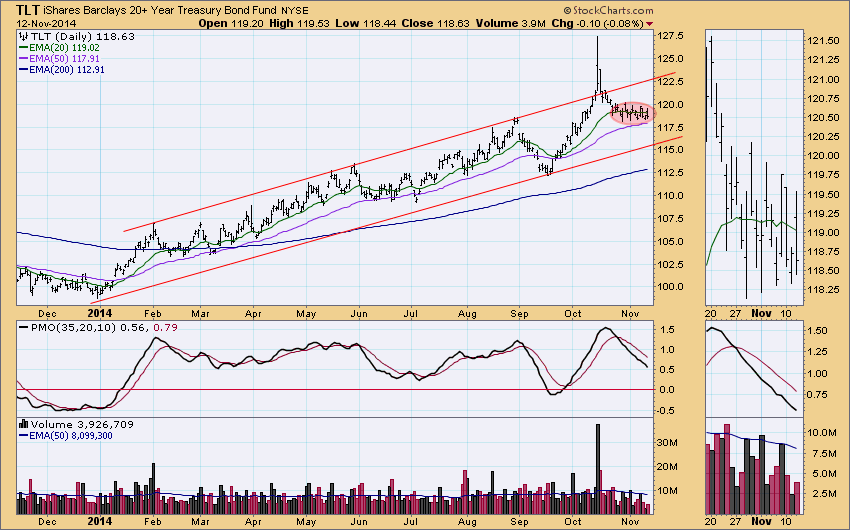
BONDS (TLT): As of 1/17/2014 The 20+ Year T-Bonds ETF (TLT) is on a Trend Model BUY signal. The LT Trend Model, which informs our long-term outlook, is on a BUY signal as of 3/24/2014, so our long-term posture is bullish.
TLT continues to consolidate sideways. What is notable in the chart is the PMO steadily falling since this continuation pattern began. This is a great example of how our indicators will sometimes leave overbought conditions while market consolidates. It doesn't always take a price decline or correction.
Technical Analysis is a windsock, not a crystal ball.
Happy Charting!
- Erin
