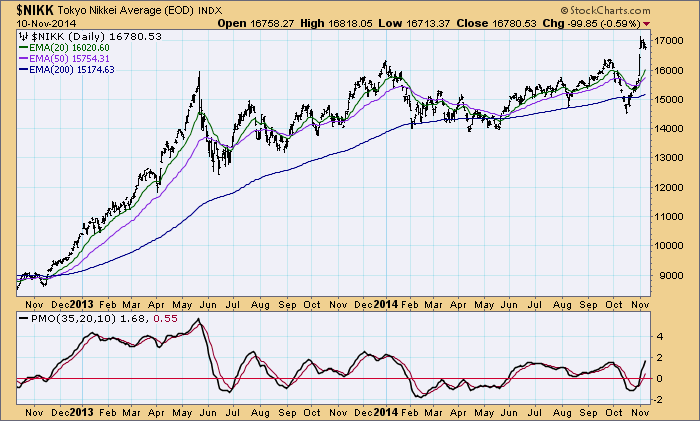
We've been hearing how Japan's latest foray into money printing has been such a great help for their stock market, but it is always best to see if the chart matches the story. After rising strongly off the late-2012 low, the Nikkei moved sideways for over two years. Then, after the BOJ stimulus announcement at the end of October, prices rose sharply for two days and have been consolidating ever since. Since it has broken above the two previous tops (2014 and this year), and since the short consolidation is a pennant formation, the short-term outlook is bullish.
However, on the monthly chart the most immediately dominant feature, in my opinion, is the double bottom formed by the 2003 and 2009 lows. A line drawn across the 2007 top is the confirmation line that must be penetrated to cause us to project possibly higher prices.
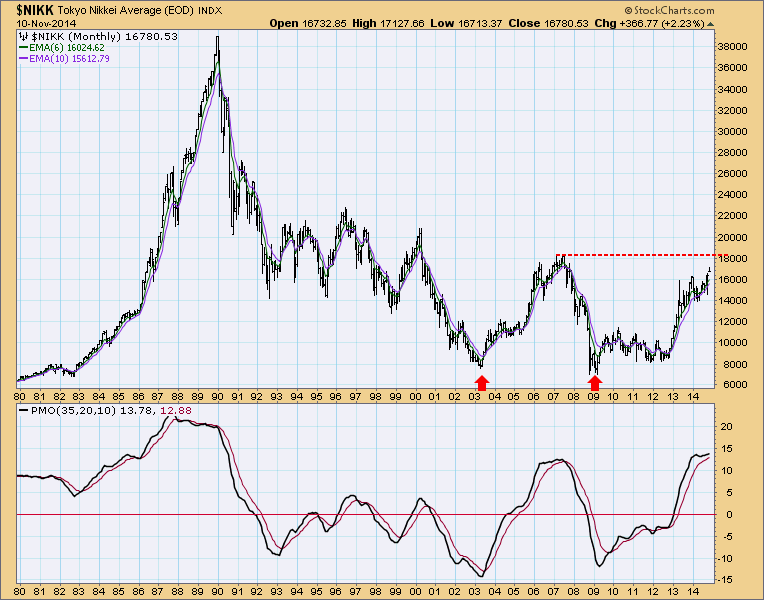
Looking at the really long term we can see another example of a parabolic advance into the 1989 top, followed by a collapse, followed by a long-term basing pattern. This is not the best example of a parabolic advance and aftermath, but it is close enough. The double bottom is bullish, but it is still within the context of a long-term trading range, and we have to wonder whether of not it will finally be broken. And we reflect that the BOJ has been stimulating for 25 years with no positive result, so will this time be any different? Doing the same thing over and over, and expecting a different result is the definition of what?
Conclusion: The Nikkei has broken out in the short-term, but it is approaching long-term resistance. We think that the chart picture is not as rosy as media headlines would lead us to believe.
