One of our favorite analysis methods is to compare price to one of its moving averages. It is not infallible, but it is thoroughly objective. In particular we track stocks in relation to their 20EMA, 50EMA, and 200EMA because that gives us views of the short, medium, and long term. Finally, we pick a market index and we determine the percentage of its component stocks that are above those moving averages. This gives us a clear picture of the amount of participation there is behind a particular price move.
This is a chart shows the indicators for the S&P 500 Index, which shows that 72% of its stocks are above their 200EMA. This is not an especially weak number, but the problem is that there is a negative divergence across the last three important tops. This shows that, in the longer-term time frame, fewer stocks are participating in each successive rally. We notice that the 50EMA and 20EMA indicators are confirming the new market high in those shorter time frames.
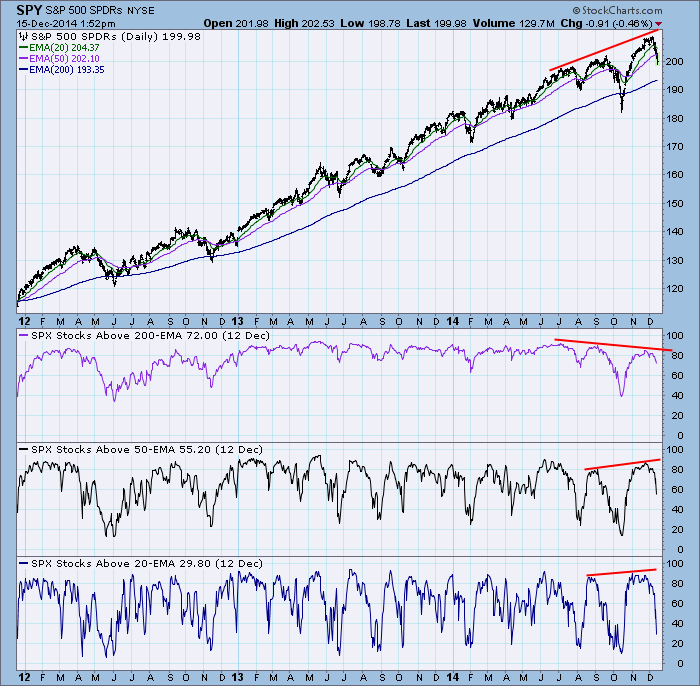
(Click here to see the chart list that has this indicator for the major market indexes and sectors.)
The 20EMA indicator is nearly at oversold levels, but the 50EMA and 200EMA indicators have plenty of room to accommodate more price decline.
When looking for divergences it is important to remember that the indicator ranges are finite (0 to 100), whereas the price scale is not, therefore, we cannot be too literal in defining what is a negative divergence. Note how in 2013 the 200EMA indicator kept hitting highs around 90 while the market kept rising. It would not have been possible tor the indicator to keep confirming new price highs.
Conclusion: A negative divergence on the 200EMA indicator tells us that the recent rally had less support than the two previous ones, showing internal weakness longer-term. All the indicators allow for further price decline, assuming that they drop to the bottom of their normal range.
