 We all want to find the best available investment opportunities, but sometimes it isn't that easy. With the market turning around and a bottom forming on the recent correction, many are looking for a way to get in. A great scan can help, but if you are in a hurry and don't want to have to weed out the chaff, the DP Trackers are your solution.
I've reviewed the Trackers in previous blog articles, but I found myself this morning using the SPX-Plus Tracker to hunt down some possible investments to take advantage of this morning's rally. There are a ton of reports in the DP Tracker Blog that follow everything from Rydex funds to popular ETFs to SPX stocks. The SPX-Plus Tracker - Daily Report 4 happens to be my favorite vehicle because it lists all Price Momentum Oscillator (PMO) BUY/SELL signals and how long a stock has been on that signal. In addition, it tells me whether the PMO is rising or falling and for how many days. It makes it easy to spot stocks with strong momentum in either direction. An excerpt is below:
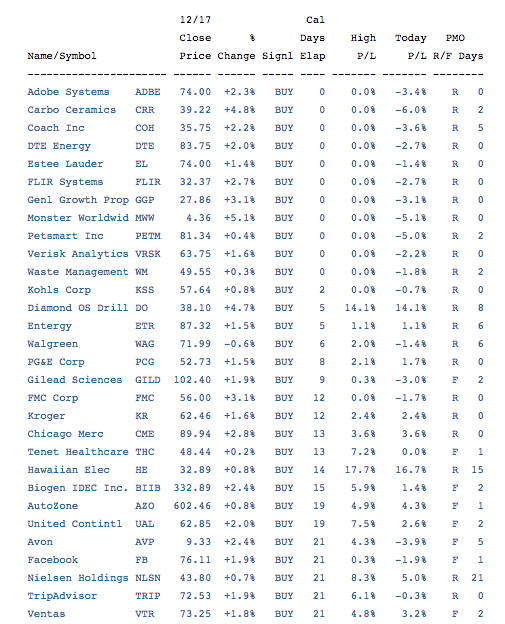
The beauty of this report is that if something looks interesting to you, just click on the line of the report and the chart will pop up on your charting workbench. Let's take a look at the first couple of new PMO BUY signals. I'm going to choose Carbo Ceramics (CRR) and Coach Inc (COH) as they are on new BUY signals. They have a PMO that has been rising more than a day and a crossover BUY signal. Not all of these 'top shelf' stocks on the table are 'winners'. This is why we look at the chart and NOT blindly follow signal changes.
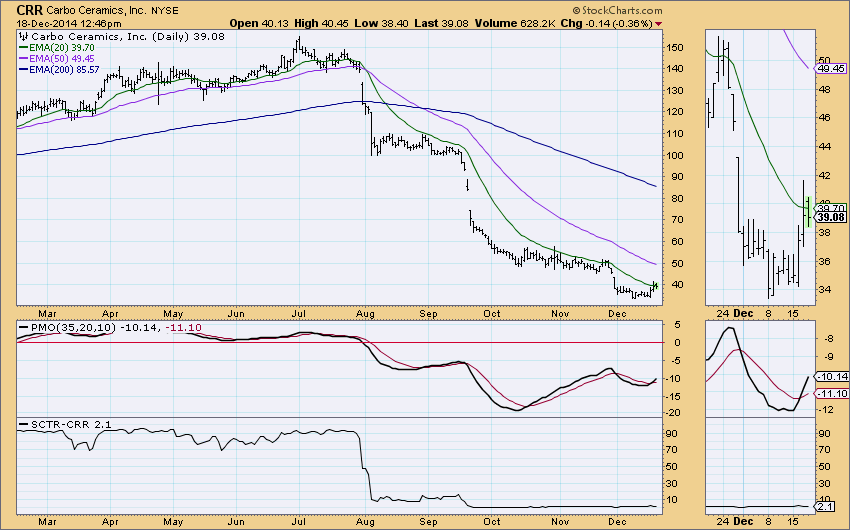
Carbo Ceramics (CCR) appeared on the Tracker as a possible investment because it just had a new PMO BUY signal and the PMO had been rising for two days. Unfortunately, this stock has been in serious decline. Oh my! Look at the SCTR, it couldn't look much worse. It's been on a Trend Model Neutral signal since the 20-EMA crossed below the 50-EMA in August. Additionally, the 50-EMA crossed below the 200-EMA at the end of August which generated a Long-Term Trend Model SELL signal. We use the PMO to follow momentum and momentum changes frequently. Therefore, you'll find stocks like this one hit the PMO BUY signal but don't necessarily have a good Trend Model configuration (20-EMA above 50-EMA above 200-EMA). Personally I didn't like this chart so I quickly closed it and moved on, clicking on the next chart of interest.
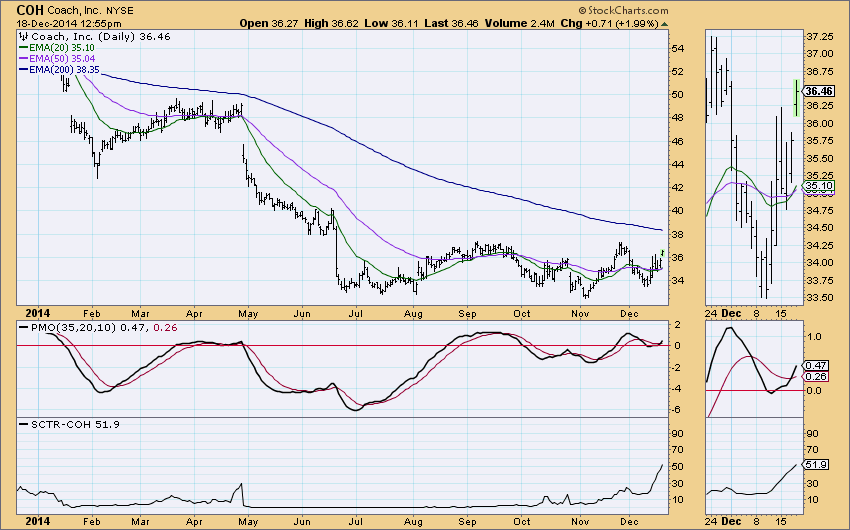
So we started with a not so good chart but as I noted above, it's easy to close and move on to the next. In this case it's Coach which has had a rising PMO for five days. This chart looks considerably better. The SCTR is rising, the Trend Model just generated a BUY signal as the 20-EMA crossed above the 50-EMA. The configuration is definitely not perfect as the PMO is overbought and the Trend Model BUY. Personally, I'd like to see a breakout above horizontal resistance at the November high, but notice so far today it is up almost 2% on the day after the BUY signal was generated.
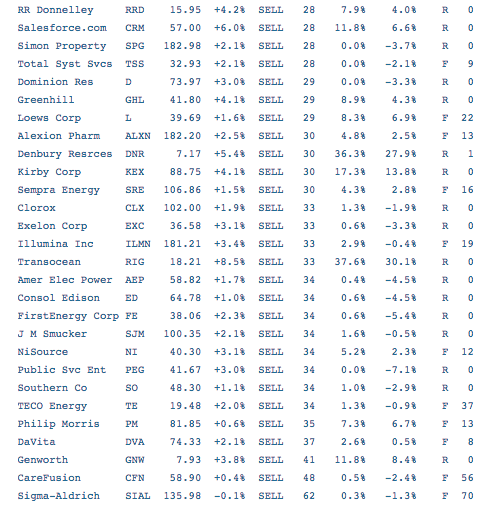
The other use of this Tracker table is to "bottom pick". That means going to the bottom of the table and find stocks that have been on SELL signals but have a PMO that has been rising. Here's an excerpt of the bottom of the table:
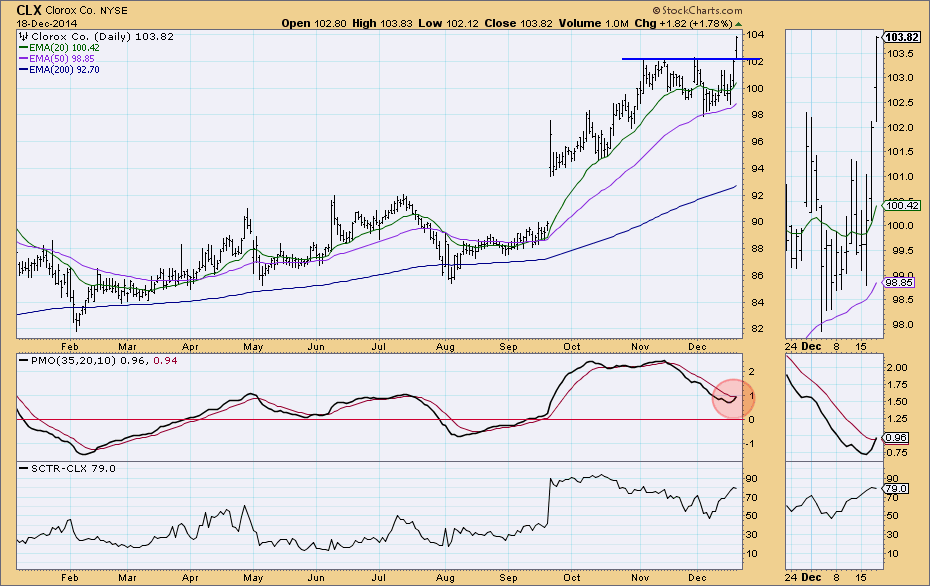
I found Clorox (CLX) interesting after reviewing many of the charts in the bottom. Here's why. First, I noticed that a PMO BUY signal was around the corner this morning and we see this afternoon, it happened. The PMO bottomed in more neutral territory than overbought. The SCTR line is trending back up and it has a reading close to 80 (I like to see 80+). Most importantly, there was a clear breakout today above the horizontal line drawn along the tops in November and December.
The DP Trackers, in this case the SPX-Plus - Report 4 are an easy way to quickly review momentum and crossover signals in tabular form but also in chart form when you find something interesting. Don't forget these gems are in the DP Tracker Blog.
Happy Charting!
Erin
