** Don't forget to sign up for the DecisionPoint LIVE! webinar! Tweet your suggestions for the reader's request chart review @_DecisionPoint **
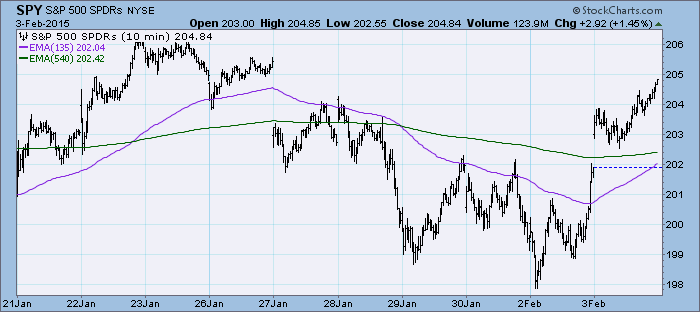
The market rallied above the previous three days' tops. A weaker dollar and stronger oil prices fueled the rally.
The purpose of the DecisionPoint Market Update is to quickly review the day's action, internal condition, and Trend Model status of the broad market (S&P 500), the nine SPDR Sectors, the U.S. Dollar, Gold, Crude Oil, and Bonds. Analysis will be quick and painless since we are as brief as possible, and often we let a chart speak for itself.
SIGNALS: Here we include the current day's signal table, an excerpt from the DecisionPoint Alert Daily Report.
DECISIONPOINT ALERT DAILY REPORT
Tuesday, 2/3/2015

************************ DECISIONPOINT MARKET POSTURE ***********************

The following is the market posture suggested by our mechanical trend-
following tools. These are not trading recommendations, rather they are price
activity flags that should be qualified by chart analysis. The Trend Model is
used on all indexes.


                                     Days   Index     02/03   Points  Percent
Index               Posture     Date Elap  @Start     Close      P/L      P/L
------------------- ------- -------- ---- -------   -------  -------  -------
Stocks Medium-Term  Bullish 10/31/14   95   200.55   204.84    +4.29    +2.1%
Stocks Long-Term    Bullish 10/31/14   95   200.55   204.84    +4.29    +2.1%
Gold (NY Spot)      Bullish 01/12/15   22  1233.40  1260.30   +26.90    +2.2%
20+Yr T-Bond  (TLT) Bullish 01/17/14  382   102.22   134.57   +32.35   +31.6%
------------------- ------- -------- ---- -------   -------  -------  -------
Dollar Index  (UUP) Bullish 07/21/14  197    21.47    24.79    +3.32   +15.5%
Commodities   (GSG) Neutral 07/14/14  204    32.64    20.81     ....     ....
Crude Oil     (USO) Neutral 07/30/14  188    36.92    19.62     ....     ....
------------------- ------- -------- ---- -------   -------  -------  -------
S&P 500       (SPY)     BUY 10/31/14   95   200.55   204.84    +4.29    +2.1%
S&P Equal Wt  (RSP)     BUY 11/03/14   92    77.77    80.16    +2.39    +3.1%
Dow           (DIA)     BUY 02/03/15    0   176.33   176.33 * Changed Today *
Nasdaq 100    (QQQ)     BUY 10/29/14   97    99.44   102.98    +3.54    +3.6%
NDX Equal Wt (QQEW)     BUY 10/30/14   96    40.52    42.54    +2.02    +5.0%
S&P 100       (OEF) Neutral 01/30/15    4    87.79    90.27     ....     ....
S&P 400 MidCp (IJH)     BUY 11/05/14   90   141.11   147.01    +5.90    +4.2%
S&P 600 SmlCp (IJR)     BUY 11/03/14   92   110.95   113.27    +2.32    +2.1%
Total Market  (VTI)     BUY 11/03/14   92   103.53   105.86    +2.33    +2.3%
Consumer Disc (XLY)     BUY 11/05/14   90    67.27    72.12    +4.85    +7.2%
Cons Disc EWt (RCD)     BUY 11/03/14   92    82.65    88.15    +5.50    +6.7%
Consumer Stpl (XLP)     BUY 08/20/14  167    44.27    49.02    +4.75   +10.7%
Cons Stpl EWt (RHS)     BUY 10/21/14  105    97.79   106.35    +8.56    +8.8%
Energy        (XLE) Neutral 09/08/14  148    94.49    79.99     ....     ....
Energy EWt    (RYE) Neutral 09/08/14  148    86.56    68.85     ....     ....
Financial     (XLF) Neutral 01/20/15   14    23.39    23.77     ....     ....
Financial EWt (RYF) Neutral 01/30/15    4    42.55    43.92     ....     ....
Health Care   (XLV)     BUY 10/23/14  103    64.07    70.13    +6.06    +9.5%
Health Cr EWt (RYH)     BUY 05/09/14  270   115.84   145.52   +29.68   +25.6%
Industrial    (XLI)     BUY 10/30/14   96    54.37    56.28    +1.91    +3.5%
Industrl EWt  (RGI) Neutral 01/27/15    7    87.50    89.21     ....     ....
Materials     (XLB) Neutral 01/06/15   28    46.99    49.18     ....     ....
Materials EWt (RTM)     BUY 02/03/15    0    85.23    85.23 * Changed Today *
Technology    (XLK) Neutral 01/29/15    5    40.40    40.77     ....     ....
Technolgy EWt (RYT) Neutral 02/02/15    1    87.21    88.79     ....     ....
Utilities     (XLU)     BUY 08/28/14  159    42.24    48.71    +6.47   +15.3%
Utilities EWt (RYU)     BUY 08/20/14  167    71.41    81.18    +9.77   +13.7%

Average                                84                               +7.7%
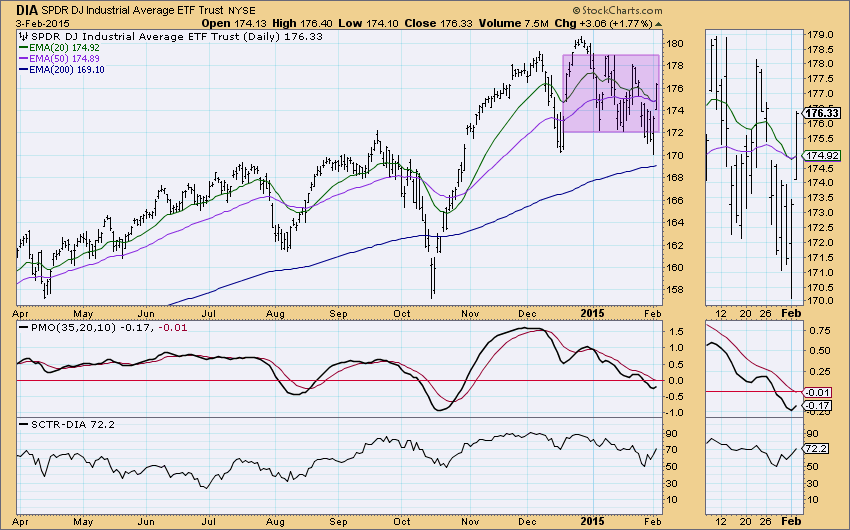
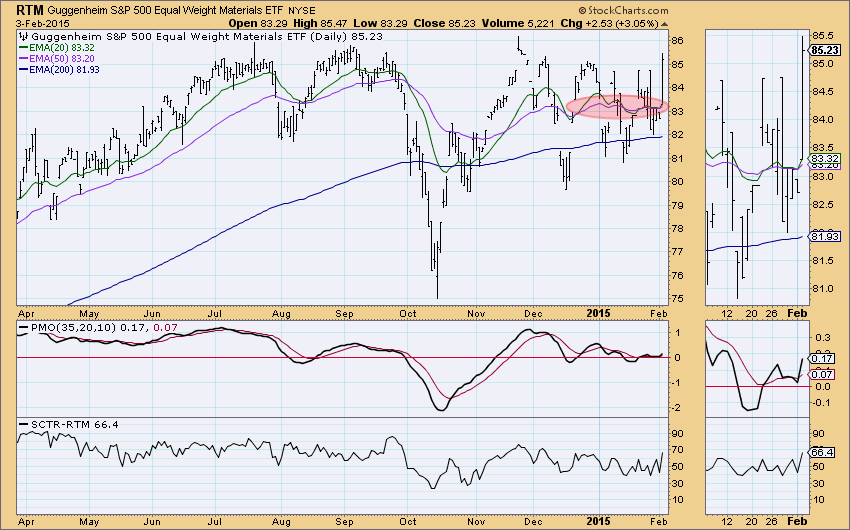
Two of the Trend Model Neutral signals that generated yesterday aborted and are back on BUY signals. One of the problems when you get into a market that is consolidating within a trading channel is that the 20/50-EMAs start to narrow and crisscross each other as prices whip from the top to the bottom and back again within the channel. DIA and RTM are experiencing some of this. Even a magnifying glass applied to the thumbnail doesn't clearly show the 20/50-EMA crossovers.
NOTE: Mechanical trading model signals define the implied bias of the price index based upon moving average relationships, but they do not necessarily call for a specific action. They are information flags that should prompt chart review. Further, they do not call for continuous buying or selling during the life of the signal. For example, a BUY signal will probably return the best results if action is taken soon after the signal is generated. Additional opportunities for buying may be found as price zigzags higher, but the trader must look for optimum entry points. Conversely, exit points to preserve gains (or minimize losses) may be evident before the model mechanically closes the signal.
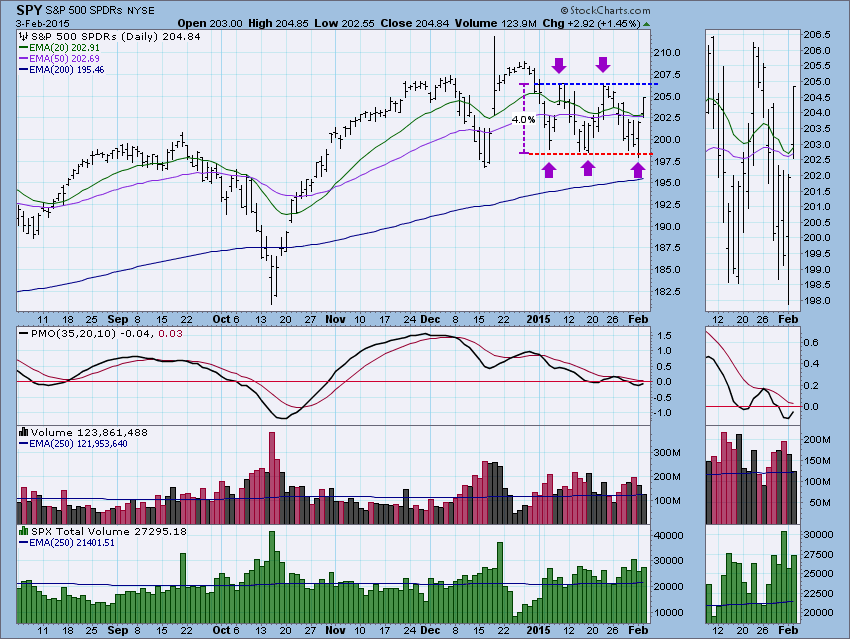
STOCKS: Based upon a 10/31/2014 Trend Model BUY signal, our current intermediate-term market posture for the S&P 500 (SPY) is bullish. The Trend Model, which informs our long-term outlook, is on a BUY signal as of 10/31/2014 so our long-term posture is bullish.
What has appeared as double-tops/double-bottoms is starting to simply boil down to a large consolidation channel. The channel has afforded savvy investors with the opportunity to make money on the 4% swings, but that is not an easy task. The PMO has turned back up, but hasn't made a crossover its EMA yet. Our Trend Model signals on the SPY are tracked by Timer Digest and I must admit to breathing a sigh of relief in seeing the 20-EMA just barely escaping a negative crossover with the 50-EMA. A Trend Model Neutral signal would protect us from a sizable decline, but as you can see from the last 20/50-EMA crossovers, it is slow to get us back in to take advantage of a ride back. I am concerned that the Trend Model is now set up for whipsaw signal changes now that the 20/50-EMAs are closing in on each other.
Ultra-Short-Term Indicators: All of these indicators experienced climaxes today. I note from previous positive spikes that this generally signifies a nearing ultra-short-term top.
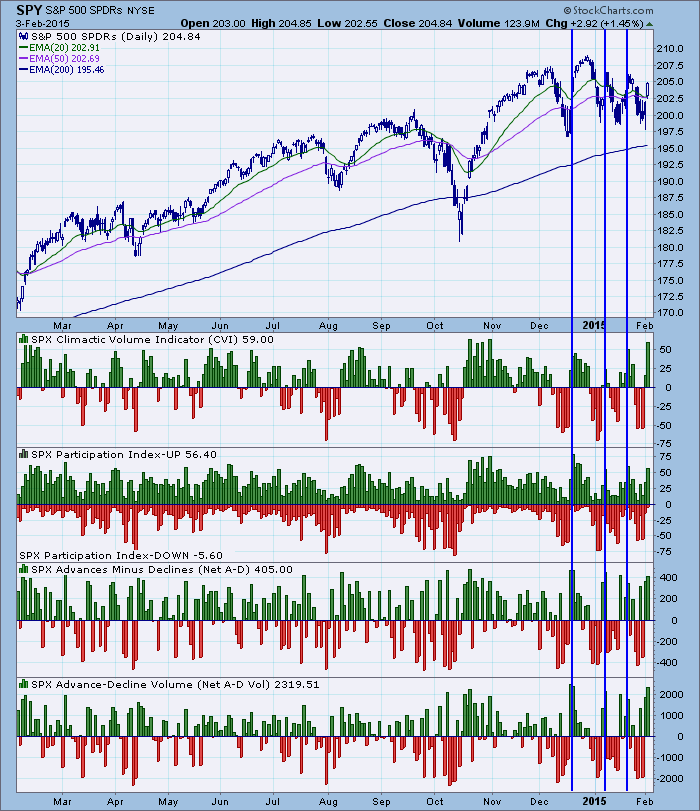
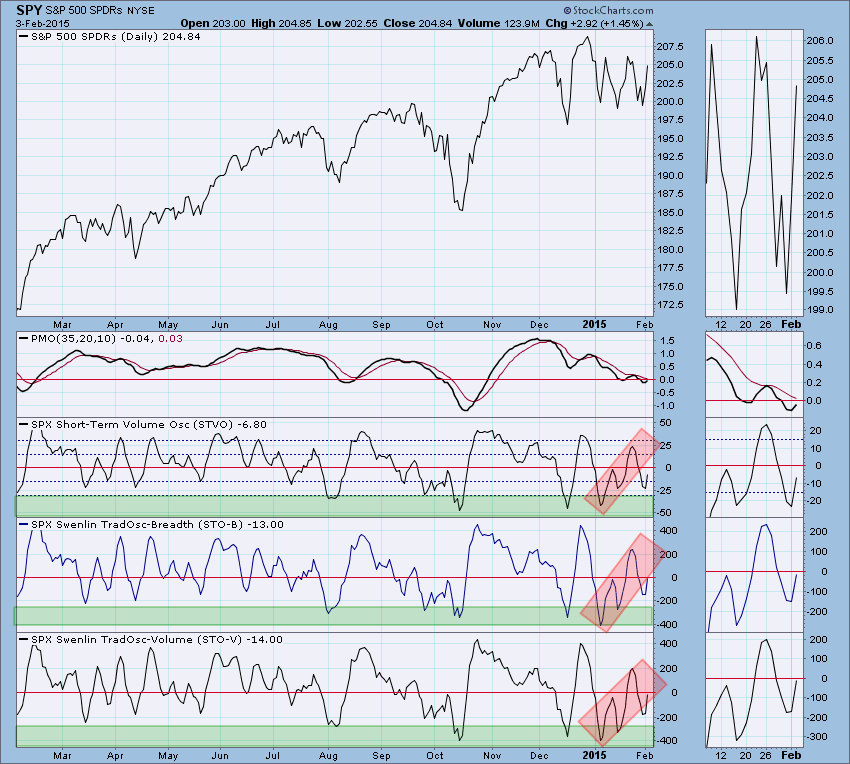
Short-Term Indicators: These indicators fell out of their rising trends during the last decline, but they are making their way back. I believe it could be considered short-term bullish that they have been rising while price has been churning. It could indicate some internal strength that may not be clear given the price consolidation.
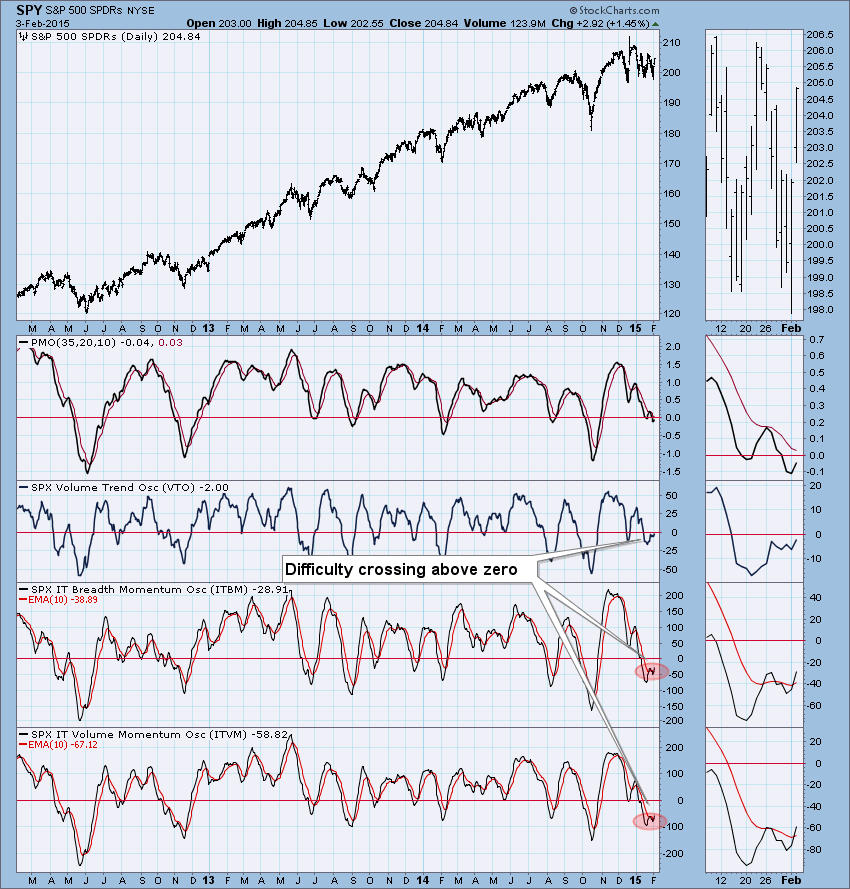
Intermediate-Term Indicators: Today saw positive crossovers in the ITBM and ITVM. While this is bullish in general, the hesitation of these indicators to pick a clear pathway and move above zero tempers any bullish enthusiasm gained from the positive crossovers.
Conclusion: Price is sticking to the inside of a 4% consolidation range which is beginning to cause the Trend Model to generate whipsaw signals on our DP Alert Daily Report. Indicators in the short- and intermediate-term time frames are technically bullish but ultra-short-term indicators are suggesting a nearing price exhaustion, maybe at the top of the trading range.
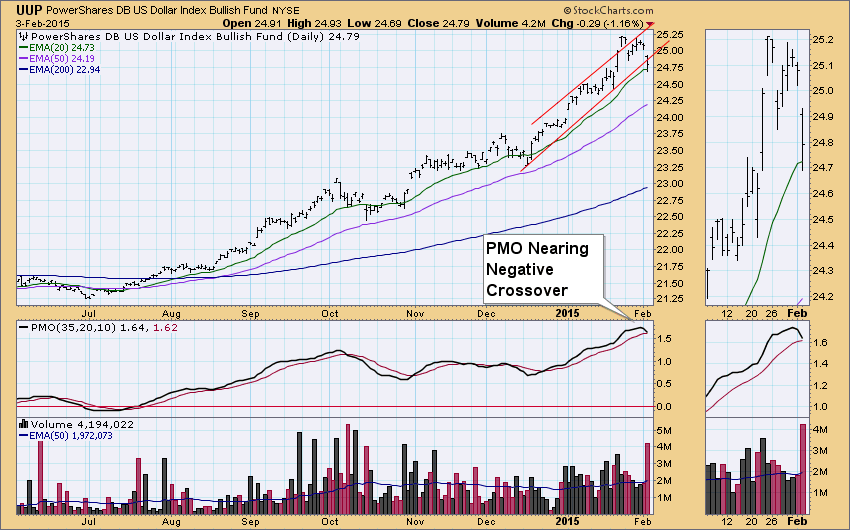
DOLLAR: As of 7/21/2014 the US Dollar Index ETF (UUP) is on a Trend Model BUY signal. The LT Trend Model, which informs our long-term outlook, is on a BUY signal as of 8/21/2014, so our long-term posture is bullish.
The dollar has managed to stay mostly within a rising trend channel until today. The PMO topped a short time ago and is nearing a negative crossover its EMA which would generate a PMO SELL signal. Volume was very high on today's decline which is negative.
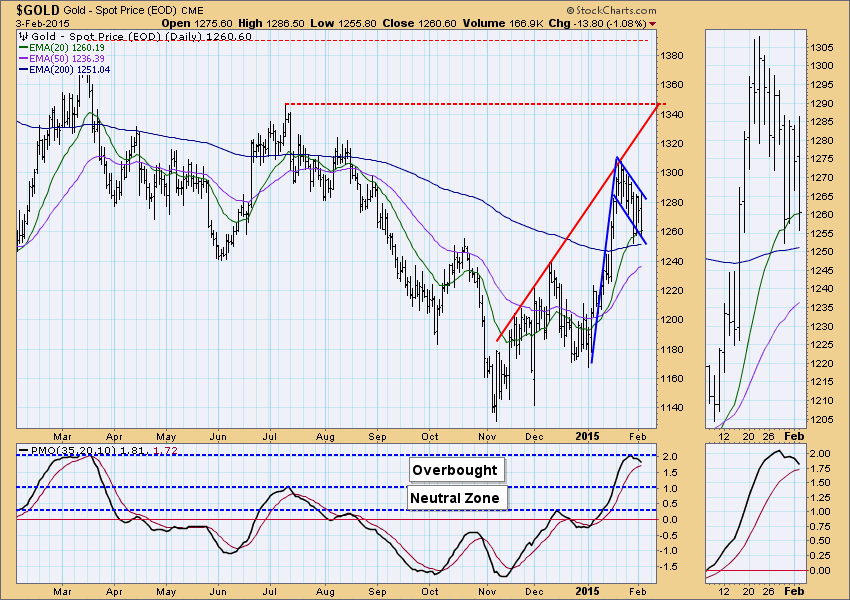
GOLD: As of 1/12/2015 Gold is on a Trend Model BUY signal. The LT Trend Model, which informs our long-term outlook, is on a SELL signal as of 2/15/2013, so our long-term posture is bearish.
After price turned back at overhead resistance in mid-January, price has been trending lower. A very large flag formation is visible to me. While this is a bullish pattern, I am uneasy about it given the switch in momentum that has the PMO nearing a negative crossover in overbought territory.
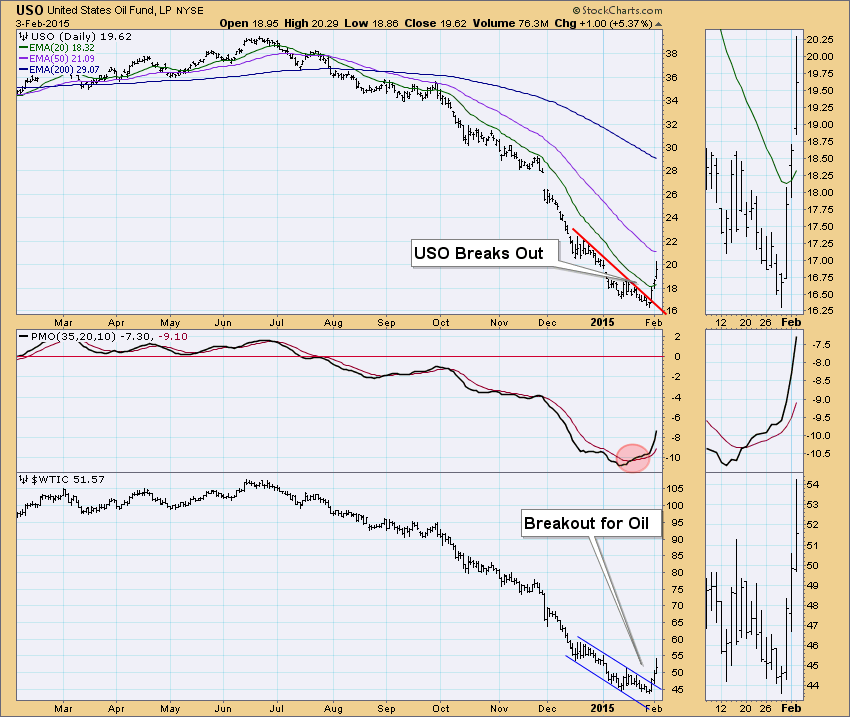
CRUDE OIL (USO): As of 7/30/2014 United States Oil Fund (USO) is on a Trend Model NEUTRAL signal. The LT Trend Model, which informs our long-term outlook, is on a SELL signal as of 8/28/2014, so our long-term posture is bearish.
I discussed the USO breakout in yesterday's blog. The PMO BUY signal and strong momentum that is carrying it higher lends credibility to this being a significant price bottom. At this point, I would expect to see a snapback followed by higher prices. The problem I see is that the recent price increase seems to be due to bargain hunting rather than supply/demand in the marketplace. Approach with caution.
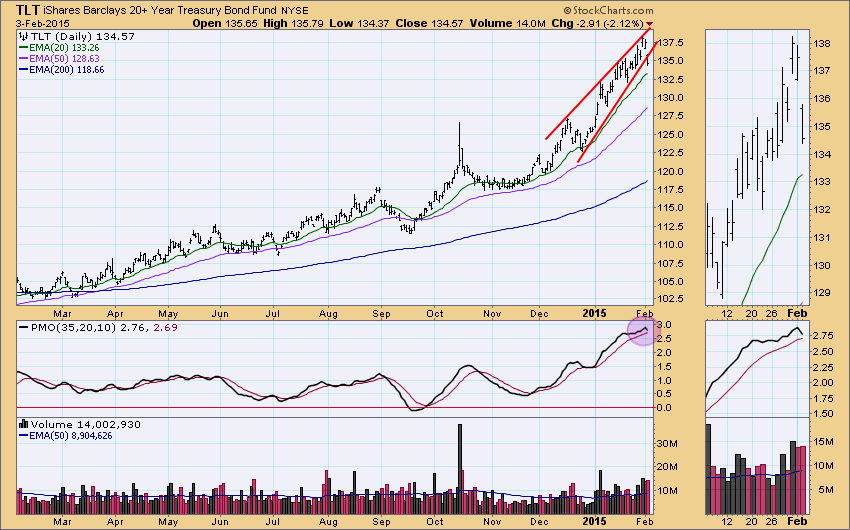
BONDS (TLT): As of 1/17/2014 The 20+ Year T-Bonds ETF (TLT) is on a Trend Model BUY signal. The LT Trend Model, which informs our long-term outlook, is on a BUY signal as of 3/24/2014, so our long-term posture is bullish.
Bonds broke down below the rising wedge which is the expectation of that pattern. The PMO topped in overbought territory and could be in for a negative crossover and SELL signal soon. This breakdown was far from significant, so based on the PMO and wedge, I'd expect to see more downside.
Technical Analysis is a windsock, not a crystal ball.
Happy Charting!
- Erin
