Yesterday an Intermediate-Term Trend Model Neutral signal was generated on TLT, the ETF we use to calculate our official Trend Model signal. This combined with a breakdown from the congestion zone and a what appears to be a breakaway gap tells us there is likely more downside to come for bonds.
Let's look at the six-month bar chart for TLT. We can see that the Trend Model Neutral signal generated because the 20-EMA crossed below the 50-EMA (seen best in the thumbnail). It was a Neutral signal and not a SELL signal because technically we consider TLT to be a "bull market" because the 50-EMA is above the 200-EMA. A Neutral signal implies that you go into cash or fully hedge. A SELL signal on the other hand would be a possible shorting opportunity. On the TLT chart there are also a few gaps that I'd like to point out.
The gap created yesterday is likely a breakaway gap. Gaps that occur right after a consolidation phase on high volume are usually breakaway gaps. What does this mean? Breakaway gaps are usually initiations in the direction they occur. In this case, the expectation is lower prices.
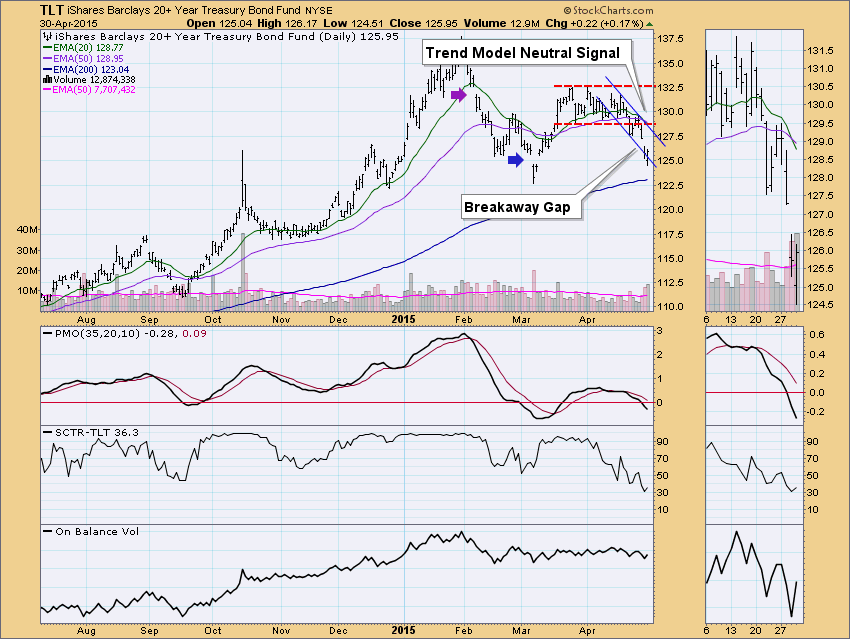
I also noted on the chart above two other gaps. The purple arrow shows another breakaway gap. It occurred on a relatively high amount of volume and broke away from the rising trend that was in place. It signaled lower prices to come, which happened. The blue arrow marks a second gap that could be considered an exhaustion gap. Exhaustions occur at the end of a trend on high volume. They aren't followed by new minor lows and they close quickly.
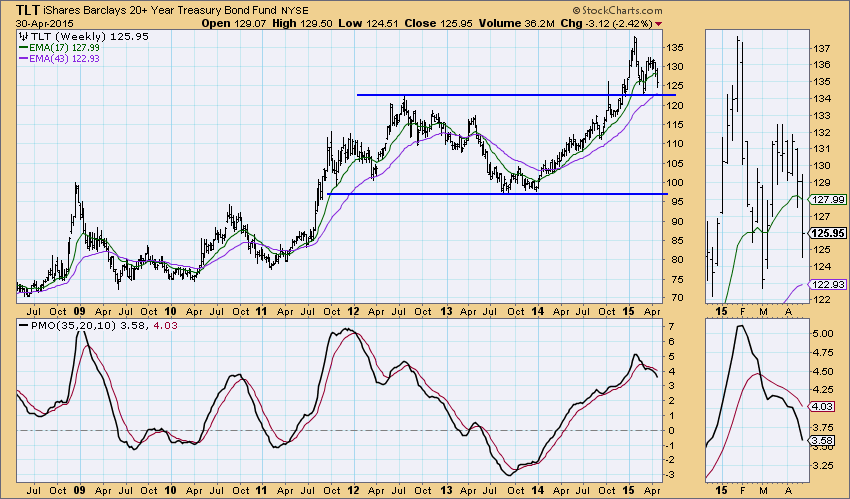
Let's look at the weekly chart below. It appears we might have an Adam and Eve double-top formation. The first top is spiky and the second is rounded. It is bearish formation and the expectation would be a breakdown below the neckline. Note that the neckline is also a strong area of support. A break below this area of support would execute that pattern. The minimum downside target would be around 110. The weekly Price Momentum Oscillator (PMO) had a negative crossover in overbought territory which is also bearish.
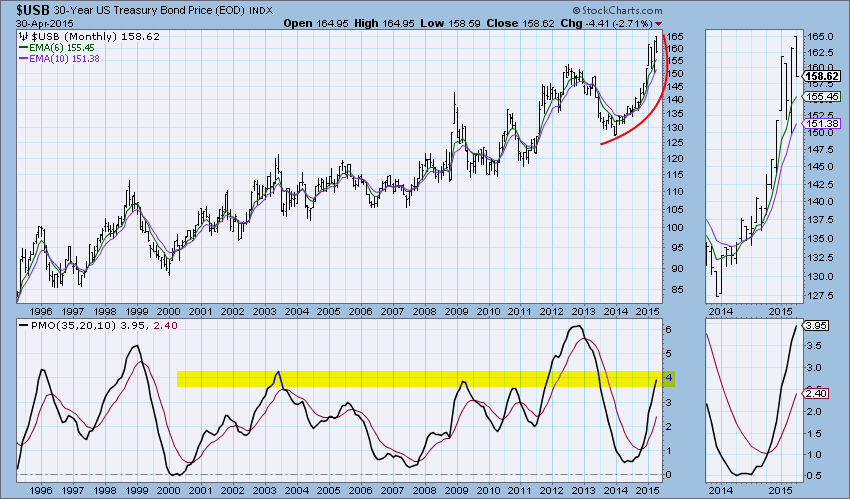
I didn't use the monthly chart on TLT below because there simply isn't enough back data for that ETF to fill the chart. Note the almost vertical price movement since the beginning of 2014. That angle of ascent is very difficult to maintain so the expectation would be an eventual breakdown and lower prices. The monthly PMO is rising strongly, but notice that it has reached somewhat overbought territory.
Given the recent Trend Model Neutral signal and the breakaway gap that helped create it, along with the Adam and Eve double-top on the weekly chart, Bonds are looking quite bearish.
Happy Charting!
Erin


