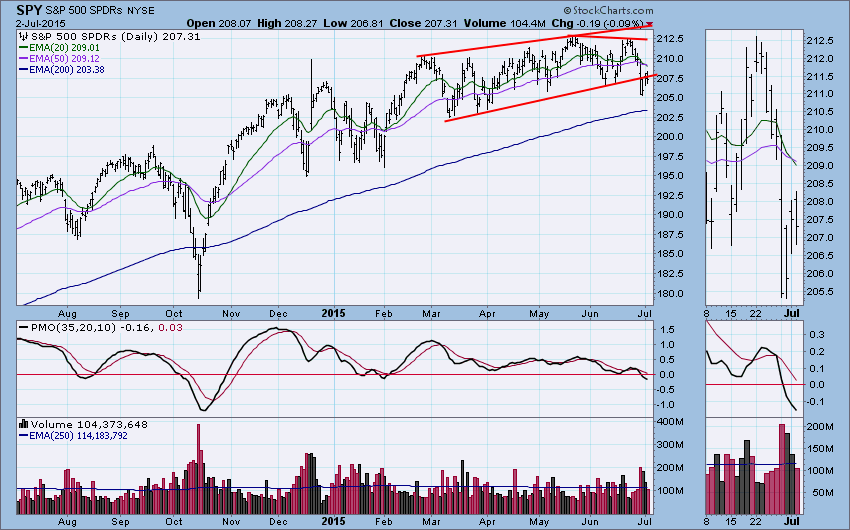
On Thursday the DP Trend Model for SPY changed from BUY (long the market) to NEUTRAL (in cash or fully hedged) when the 20EMA crossed down through the 50EMA. Why doesn't the model change from BUY to SELL (short the market)? Because the 50EMA is still above the 200EMA, which, by our definition, means SPY is still in a long-term bull market. In this type situation the Model design assumes the 20/50 crossover is only signalling a correction, not a bear market. If a correction turns into a bear market, the model is safely in cash. Otherwise, once the correction is over, the 20EMA will eventually cross up through the 50EMA and generate a new BUY signal. The objective of the Model is to exercise caution when sufficient weakness is shown. Also, the Model signal is an information flag, not an action command, and we need to look more closely at trend and condition.
Let's zoom out to a three-year view of SPY. We can see a pretty well defined rising trend channel. Remember, the rising bottoms line defines the trend, and the rising tops line defines the top of the channel. The dotted line defines a channel bottom within the wider channel formed by a line drawn across the November 2013 and October 2014 lows. There is a rising wedge that has resolved downward, as expected, but in the process price also broke down through the first rising trend line, making this a more serious issue. We can also see that price has crowded the top of the channel for nearly two years, but that ended this year when price began moving nearly sideways across the channel and is close to challenging support of the second rising trend line.
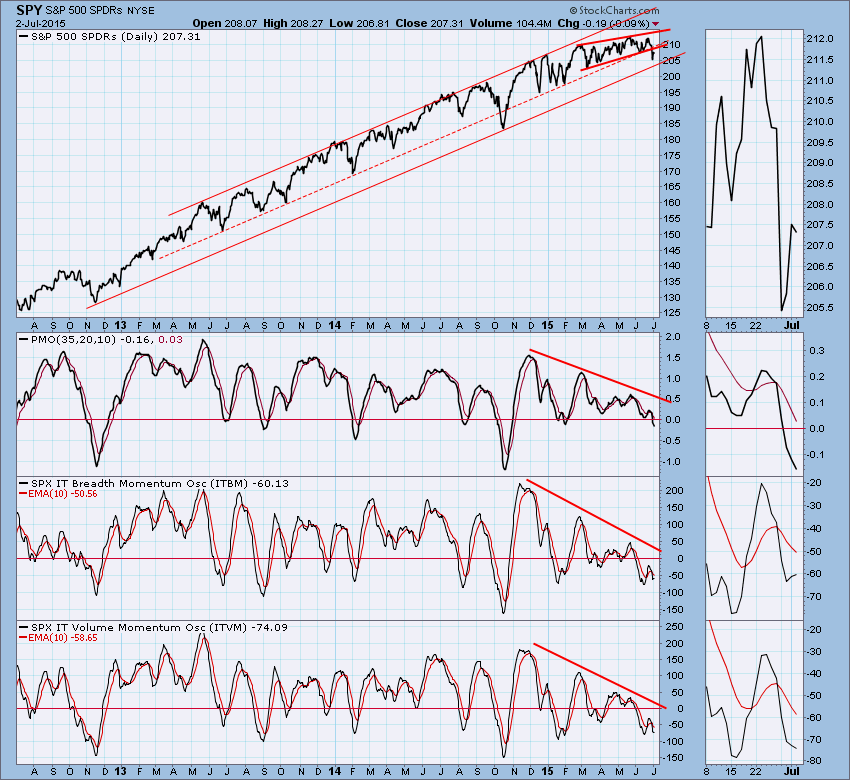
The chart also displays the primary indicators I use for longer-term analysis. These indicators give us feedback on price (PMO), breadth (ITBM) and volume (ITVM), and they are all below the zero line and have been diverging negatively from price for many months. They are all somewhat oversold, but they still have plenty of room before they reach the bottom of their normal range, about -250.
A final piece of evidence is that the monthly PMO has crossed down through its signal line, which gives us a long-term PMO SELL signal, which hasn't happened since the 2007 market top.
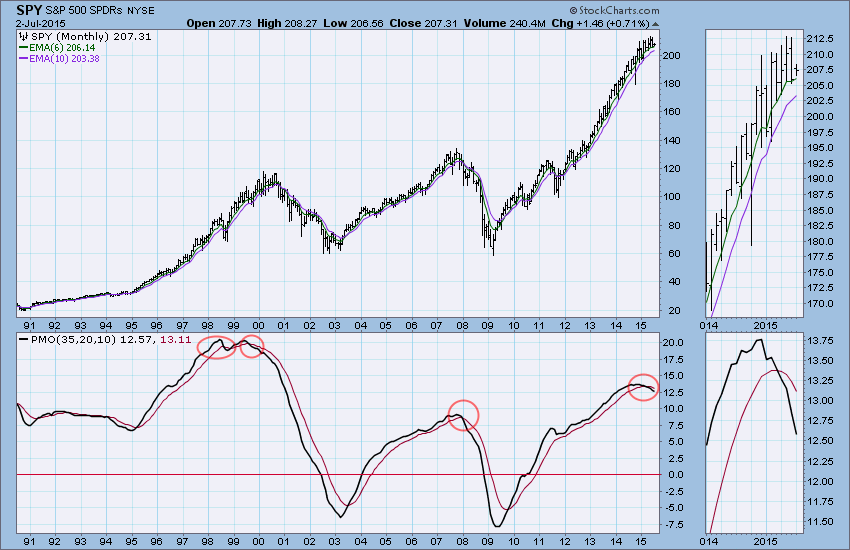
SUMMARY: Price has weakened within the two-year rising trend channel, and the internal indicators show steady and substantial deterioration. My opinion is that we are probably watching the formation of a major top. Nevertheless, I am prepared to be wrong about that. SPY is still on a Long-Term Trend Model BUY signal and is more than nominally bullish in that time frame. In fact price and the 50EMA are still well above the the 200EMA. But the monthly PMO SELL signal is a heavy piece of bearish evidence that seriously undermines that bit of optimism.
Subscribe to Carl's free blog and receive email whenever a new article is posted. See subscription links at the upper right corner of this page.
Technical analysis is a windsock, not a crystal ball.


