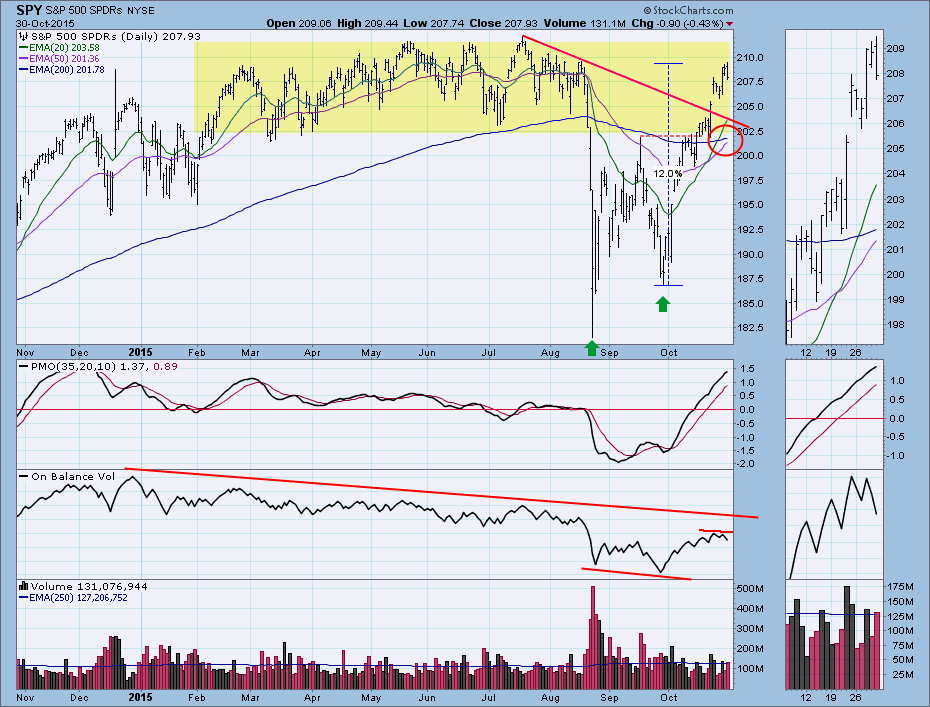
Market on the verge of what? That is the question. The 50EMA is very close to crossing up through the 200EMA, which would change the long-term status from bearish to bullish. And SPY is only about 2.5% away from making new highs. What could go wrong?
Some other things that are right with this chart: After a nasty August and September, SPY rallied +12% off the September low. In the process it broke through the double bottom confirmation line drawn across the September price top, which gives us a minimum upside target of 217 (measured from the September low). Shortly after that SPY broke through the declining tops line. Considering all this evidence, we could say that the market is on the verge of making new highs and resuming the bull market.
Now let's evaluate the bearish evidence: (1) It would take only a -3% decline to abort the impending 50/200EMA upside crossover--price would then be below those EMAs, turning them back down. A small correction could easily produce a decline -3%; (2) Volume as expressed by OBV has not kept up with the price advance. It hasn't even reached the declining tops line, and the last OBV top was lower than the previous one, forming a negative divergence against the higher price top; and finally (3) the PMO is fairly overbought and price is in a zone of resistance, setting the stage for a possible correction.
CONCLUSION: So are we on the verge of still higher prices, or will the bear market reassert itself? The market has been nothing but bullish since the rally from the September low, and all but three of the 27 market and sector indexes we track in the DecisionPoint Alert are on intermediate-term BUY signals. While it does appear that the market is setting up for a correction, based upon recent price behavior, I have to assume that the correction will not be severe, and that new price highs are just weeks away.
Technical analysis is a windsock, not a crystal ball.


